Prism Grouped Table
This batch action allows the user to export Regular Token (all available tokens, including Custom tokens), Statistic Token and Keyword Token into Grouped Tables within the GraphPad Prism file defined in the Prism Project batch action.
In a Grouped Table (two grouping variables) your data can be categorized by two variables. The idea of grouped variables is best understood by example. One grouping variable might be "male vs. female"; the other grouping variable is "control vs. treated." Every data point you collect is categorized by both grouping variables: "male vs. female," AND "control vs. treated". In GraphPad Prism this table can be used to perform several types of analysis (e.g. Two-way ANOVA (and mixed model); Three-way ANOVA (and mixed model); and others...). More details on a Grouped Table can be found in the GraphPad Prism User Manual.
Note: pictures cannot be added to this report.
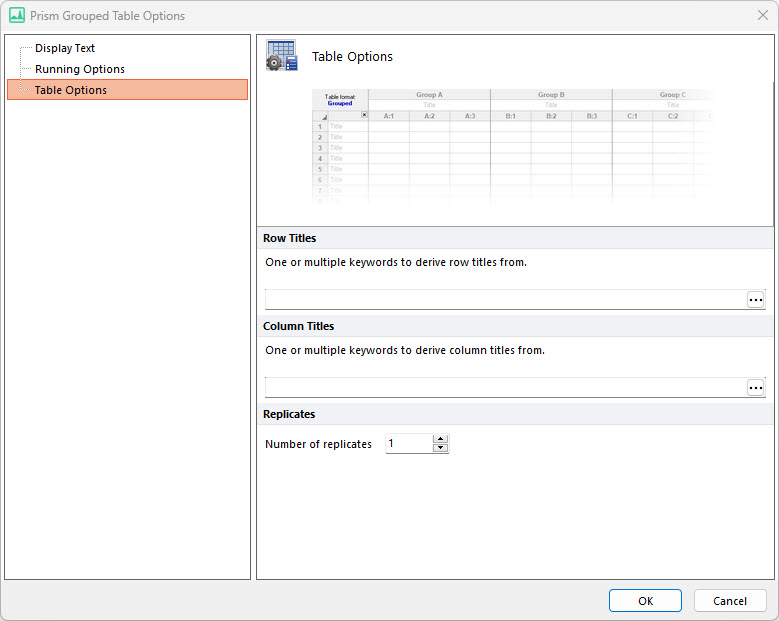
When a Grouped Table report is created, the Prism Grouped Table Options dialog opens (Figure 8.26). It has three sections:
•Table Options
This section (See figure below) allows the user to specify the keywords to use to organize the data into the Grouped Table.
A Prism Grouped Table needs to have both grouping keywords defined. A grouping keyword should be selected for Row Titles and for Column Titles. If these are not available, a Column table should be used instead.

Figure 8.26 Prism Grouped Table Options
Row Titles |
One or multiple keywords to derive row titles from. This value will be the first grouping variable for the data. Note that it is possible to insert multiple keywords, using the following style: <keyword1> <keyword2> <keyword3> |
Column Titles |
One or multiple keywords to derive column titles from. This value will be the second grouping variable for the data. Note that it is possible to insert multiple keywords, using the following style: <keyword1> <keyword2> <keyword3> |
Replicates |
The number of replicates defines the number of sub-columns in each Column Group. Prism uses these sub-columns to calculate error bars. |
In the example below (Figure 8.27), the Gate 1 (# of Events) statistics has been exported into a Grouped Table.

Figure 8.27 Example of a Prism Grouped Data Table
Once the table has been added to the Prism Project, the item(s) to be exported to table can be added (please see the Adding Items to Reports chapter).
