Prism XY Table
This batch action allows the user to export Regular Token (all available tokens, including Custom tokens), Statistic Token and Keyword Token into XY Tables within the GraphPad Prism file defined in the Prism Project batch action.
In an XY Table, every point is defined by both an X and a Y value. In GraphPad Prism this table can be used to perform several types of analyses (i.e. Nonlinear regression (curve fit); Linear regression; Fit Spline/LOWESS; Smooth, Differentiate or Integrate Curve; Area Under Curve; Deming (Model II) Linear regression; Correlation matrix; Correlation XY; Interpolate a Standard Curve). More details on a XY Table can be found in the GraphPad Prism User Manual.
Note: pictures cannot be added to this report.
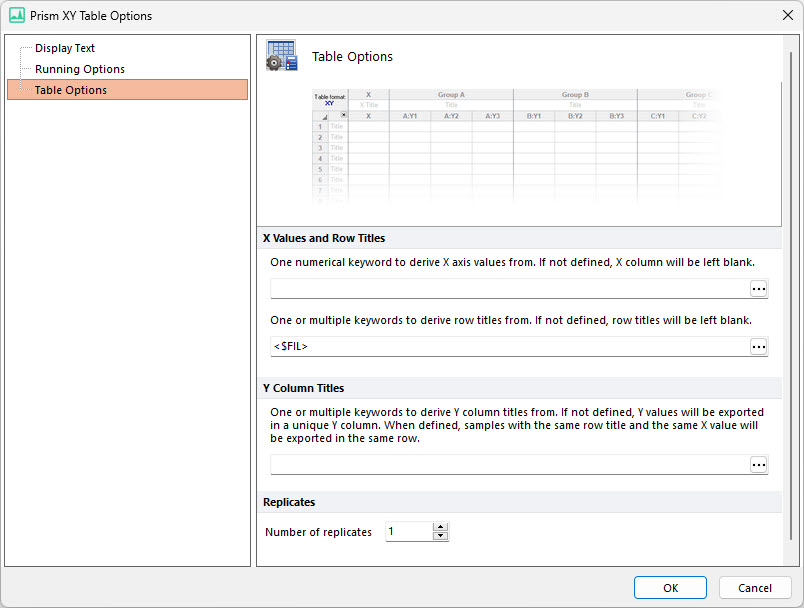
When an XY Table report is created, the Prism XY Table Options dialog opens (Figure 8.22). It has three sections:
•Table Options
This section (See figure below) allows the user to specify the keywords to use to organize the data into the XY Table.

Figure 8.22 Prism XY Data Table Options
X Values and Row Titles |
Keyword to derive X axis values from. |
Select a Keyword for the X values. Said keyword must contain only numerical values. Note that there is only one "X" column per Table. |
Keyword to derive row titles from. |
Select a Keyword to define the row titles. This value labels individual subjects or samples. Note: It is possible to insert multiple keywords, using the following style: <keyword1> <keyword2> <keyword3> |
|
Y Column Titles |
Keyword to derive Y column titles from. |
Select one or multiple keywords to derive Y column titles from. These are the remaining columns after the "X" column has been defined. Note: It is possible to insert multiple keywords, using the following style: <keyword1> <keyword2> <keyword3> |
Replicates |
Number of replicates |
The number of replicates defines the number of sub-columns in each Group. Prism uses these sub-columns to calculate error bars. |
In the example below (Figure 8.23), the Gate 1 (# of Events) statistic has been exported into an XY Table. The number of replicates has been set to 2 to allow sub-columns.

Figure 8.23 Example of a Prism XY Data Table
Once the table has been added to the Prism Project, the item(s) to be exported to table can be added (please see the Adding Items to Reports chapter).
