Adding a Text Box to a Plot

Contents
You can also place a text box directly inside a plot using one of the following methods:
•Putting the plot in Edit Mode by clicking anywhere inside it, followed by selecting the Insert→Text Box command and then clicking inside the plot.
•Right-click on a plot and select Add Text Box. A Text Box will be inserted inside the plot borders.
These text boxes can be formatted and used like any other text box within an FCS Express layout. For example, a table can be added to the text box and then Tokens can be added to the cells of the table.
Statistics Tables can be directly embedded into a plot through a drag and drop process. When this is done FCS Express will automatically create a table within that plot (Figure 5.166).
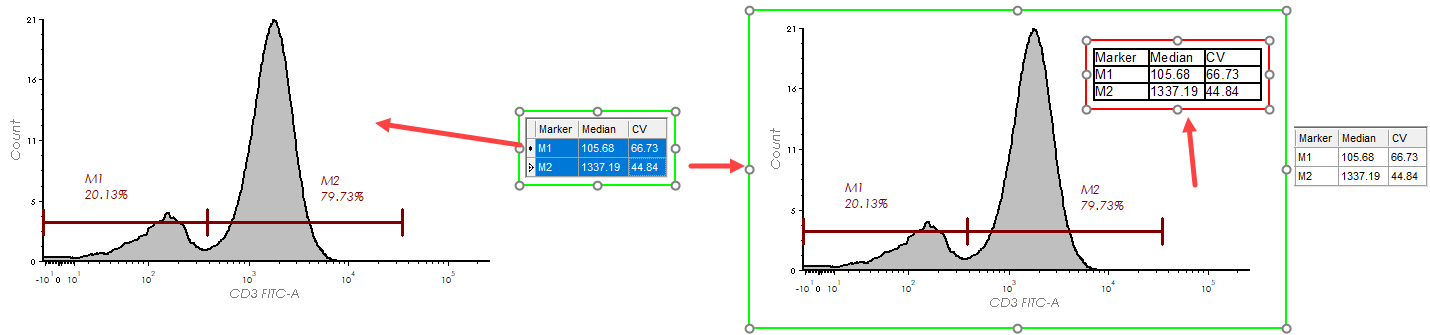
Figure 5.166 - Embedding a Table within a Plot by dragging and dropping from a Statistics Table.
If you have deleted a marker, quad, or gate text box from your plot, you can recreate them by right-clicking on the plot and choosing the appropriate command (Text Boxes→Recreate Marker Text Boxes (not shown in image below), Text Boxes→Recreate Gate Text Boxes, or Text Boxes→Recreate Quad Text Boxes from the pop-up menu (Figure 5.167).
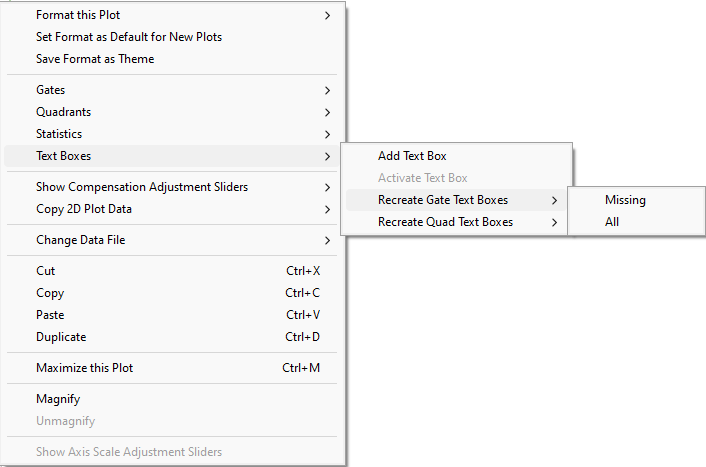
Figure 5.167 - Right-click Pop-up Menu wth Recreate Gate and Quad Text Boxes Commands and Activate Gate command.
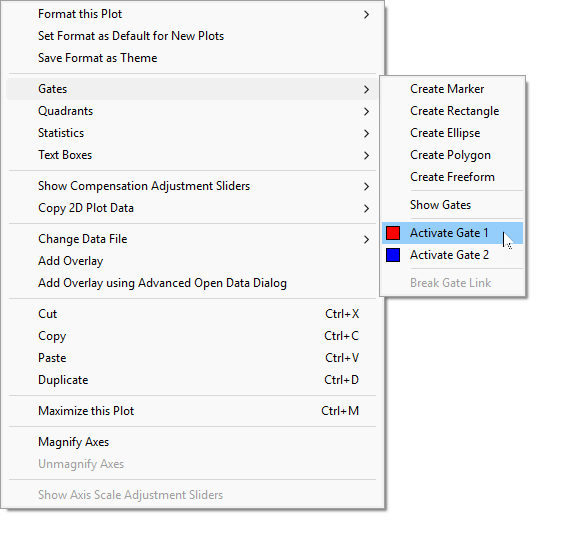
Sometimes Gates and Gate Text Boxes overlap each others. If a gate text box is behind a gate and can not be selected, right-click on the plot and choose the Activate gate command (Figure 5.168) to select the gate and move to desired location.
Note: Gate, marker, and quadrant defined text boxes may be place in a mode where they are not selectable if desired.