Appearance Options

Contents
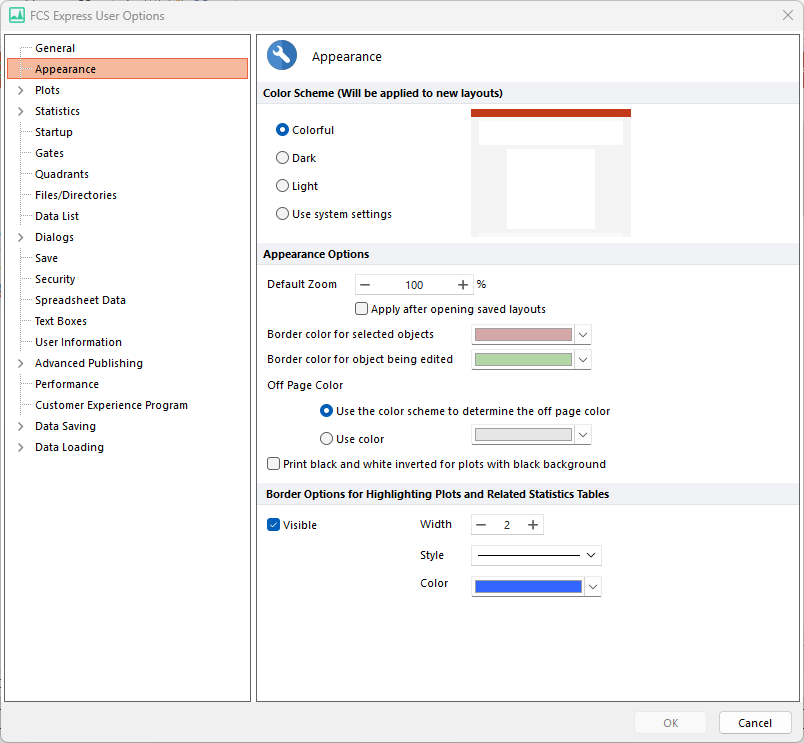
These options allow you to chose the color scheme of the user interface, the border colors for objects in select and edit mode, and the border for highlighted plots and their related statistics tables.
Color Scheme
Option |
Explanation |
Colorful |
Top ribbon appears orange and the user interface background is gray. |
Dark |
Top ribbon and user interface appear black. |
Light |
Top ribbon and user interface appear gray. |
Use system settings |
FCS Express user interface color theme and ribbon will match the color theme of the computer operating system. |
Appearance Options
Option |
Explanation |
Default Zoom |
You can customize the default zoom for new layouts. Also, you can choose to Apply after opening saved layouts to applies the chosen default zoom level when opening layouts that were originally saved with a different zoom level. |
Border color for selected objects |
Choose the color of the border displayed when an object is selected from the drop-down color pallet. |
Border color for object being edited |
Choose the color of the border displayed when an object is being edited from the drop-down color pallet. |
Off Page Color |
Choose the color of the background surrounding the page. |
Print black and white inverted for plots with black background |
When this option is selected, when displaying plots with black backgrounds, those plots will print out white, rather than black. |
Border Options for Highlighting Plot and Related Statistics Tables
Option |
Explanation |
Visible |
Any plots that have a related statistics table in the layout will be surrounded by a border when the statistics table is selected. The aesthetics of this border can be defined using the options that follow. |
Width |
The line width of the border. |
Style |
The style of the border. E.g. solid line, dash. |
Color |
The color of the border line. |