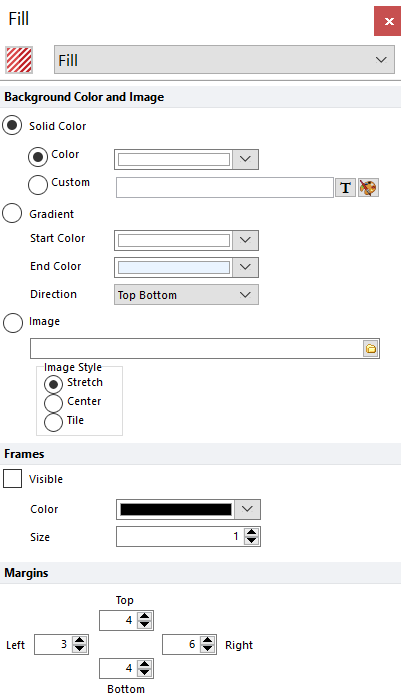
Background / Fill
When an object is in edit or selected mode, the background is the area within the red or green outline.
You can format the Background Color and Image in one of two ways:
•Select the object(s) and use the Format→Object Options→Fill command.
•Right-click on the object, select Format from the pop-up menu, and choose Fill from the drop down as shown in Figure 5.292.

Figure 5.290 Formatting Background dialog for a plot
Once the dialog opens, select a background color (Solid or a Gradient of colors). The Solid color can be selected from the Color drop down palette, or from the Custom option. The Custom option can use a Custom Token to determine whether the background turns a specific color. For example in Figure 5.293, the dot plot will turn green if the % of Lymphocytes is greater than 10. Note: The output of the formula must be the regular name of a color, such as "green" or "blue" or you can use the hex code for a color, preceeded by a $, such as "$FF1E00."

Figure 5.291 Custom formula determines background fill color
Alternatively, an Image can be centered, stretched, or tiled in the background.
With some objects (e.g., text boxes, gate views, or shapes) the dialog title is Formatting Fill/Background. With these items, you can also choose a pattern as a fill or make the background transparent. Transparency allows any object which is behind the item to show through. Plots do not support the Transparent option.
The Frames option (for plots) controls whether or not frame lines are Visible on top and to the right of the plot. You can also set the Color and Size (thickness) of the frame lines.
With the Margins options (seen when formatting plots), you can set the space around the margin of the plot. This is most useful when the text on the right-most x-axis label of the plot is being cut off. To correct this, increase the right margin percentage to increase the space between the right margin and the end of the x-axis.
