Creating a Gate from a Marker
We will continue using the same layout we were using above in the previous section.
To create a Gate from a Marker on a 1D plot:
1.Click the Page 2 tab from the Layout Navigation Toolbar (lower left of the window). You will see a histogram and dot plot displaying the ApoMono.001 data file.
2.Select both the histogram and the 2D plot contained in this page by pressing Ctrl+A on your keyboard.
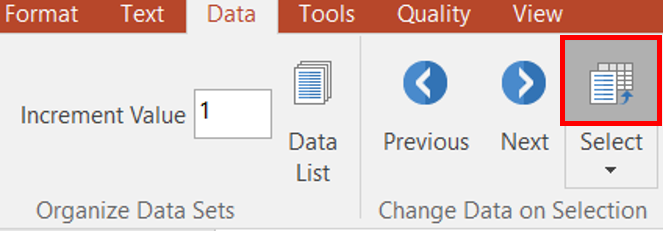
3.Select the Data tab→Change Data on Selection group→Select command to display a different data file in the plot (Figure T4.14, red outline).

Figure T4.14 Changing Data for Plots on Page 2 Using Select Command from Ribbon
4. In the Select data file dialog, browse to and select the ApoMono.002 FCS file located in the Tutorial Sample Data archive.
5. Click Open file.
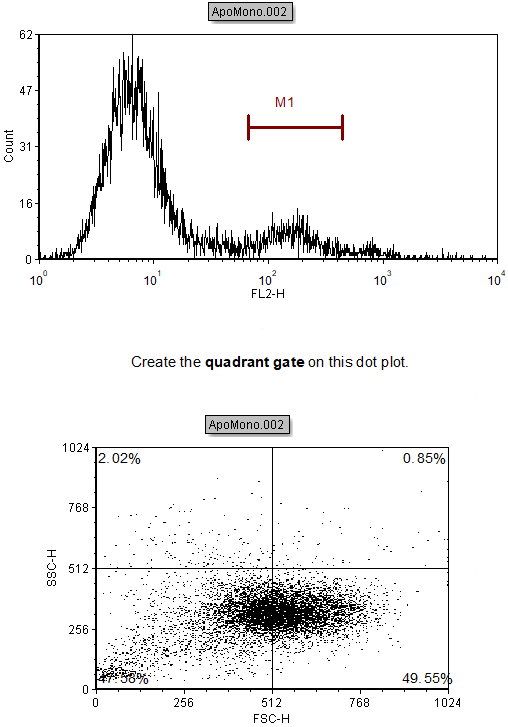
The histogram and 2D plot should resemble Figure T4.15.

Figure T4.15 Histogram and 2D Plot Displaying ApoMono.002
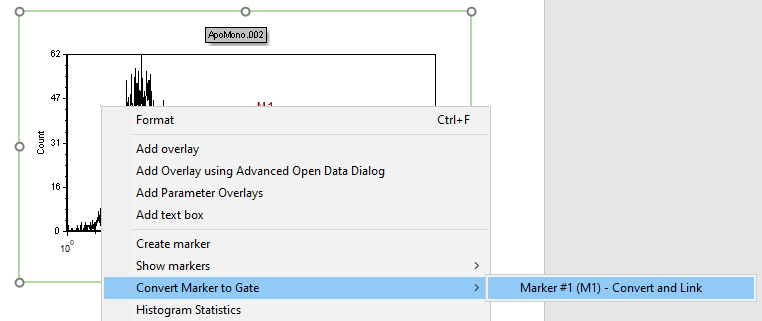
6.Right-click on the histogram to access the pop up menu.
7.Select Convert Marker to Gate → Marker #1 (M1) - Convert and Link from the pop-up menu (Figure T4.16, blue highlighted text).

Figure T4.16 Convert Marker to Gate
The Create New Gate dialog will appear (Figure T4.7).
8. Enter "Marker Gate" in the Create a new gate named field.
9.Press OK to accept the name.
The gate is now linked to the marker because we selected Convert and link in step 7. When we move the marker, the linked gate will move to reflect the new marker position.
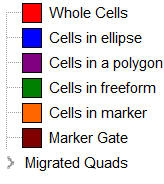
Note you can track gate creation and hierarchy through the Gate View and Gate Navigator. You can find the Gate View in the gray space on Page 2 of this layout (Figure T4.17). Note the presence of the new "Marker gate" gate.

Figure T4.17 Gate View
For reference, to open a Gate View object:
•Select the Gate View button ![]() in the Insert tab.
in the Insert tab.
•Click the left mouse button on layout where you want to insert the Gate View.
Note: Please save this layout to your desktop if unable to complete the next tutorial section.
In the next section, we will create combination gates.
