Overlays
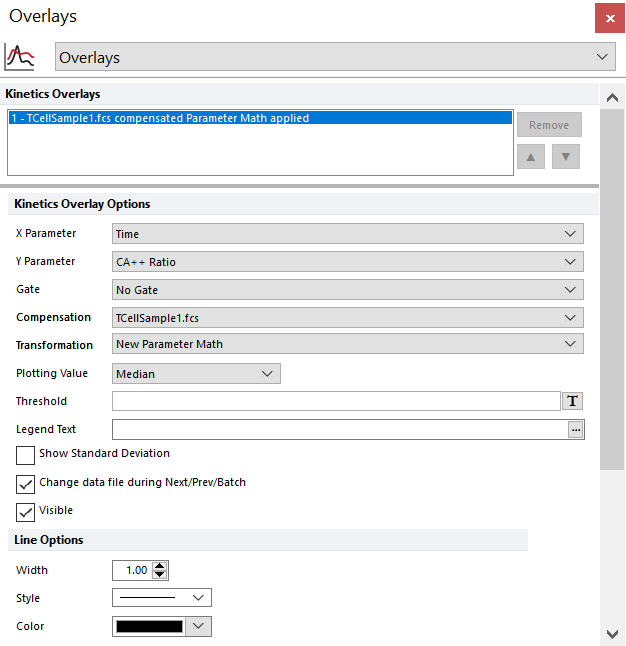
When formatting Kinetics plots, the Overlays category has important properties which control their appearance. You can format these properties in one of two ways:
•Select the Kinetics plot and use the Format→Plot Options→Overlays command.
•Right-click on the Kinetics plot, select Format from the pop-up menu, and choose Overlays from the dropdown (Figure 5.45).

Figure 5.45 Formatting Kinetics Overlays
Choose a Plotting Value, which represents either the method used to average the Y-axis values (Mean, Geometric Mean, Median, Count) or the % Above Threshold. Count represents events versus Time (i.e., event rate). If there are no problems running the sample, Count should be relatively constant.
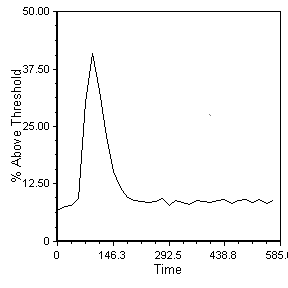
Using % Above Threshold as a plotting value (Figure 5.46) is useful to determine what percent of the cells responded in the kinetics analysis. A threshold value (set in the Threshold field) can either be set manually after determining a cut-off value from the Y-axis or by inserting one or more statistic token(s) into a formula.

Figure 5.46 Plotting the % Above Threshold Value
The Show Standard Deviation check box controls whether or not one standard deviation of the Y-axis value is shown (in red) around the plotted value.
