Inserting a plot via the Insert tab
All objects in the Insert tab can be inserted into the layout in the same way.
As an example, we will insert a Color Dot plot:
1.Select the Insert tab→1D and 2D Plots group→Color Dot command  .
.
2.To insert a plot with the default size
oOn the page, click the mouse where you want the top-left corner of the plot to appear.
To insert a plot with a custom size:
oOn the page, Press and hold the left mouse button down, where you want the top-left corner of the plot to appear.
oMove the cursor, while holding the mouse button down, until the sizing rectangle is the size you want the plot to be.
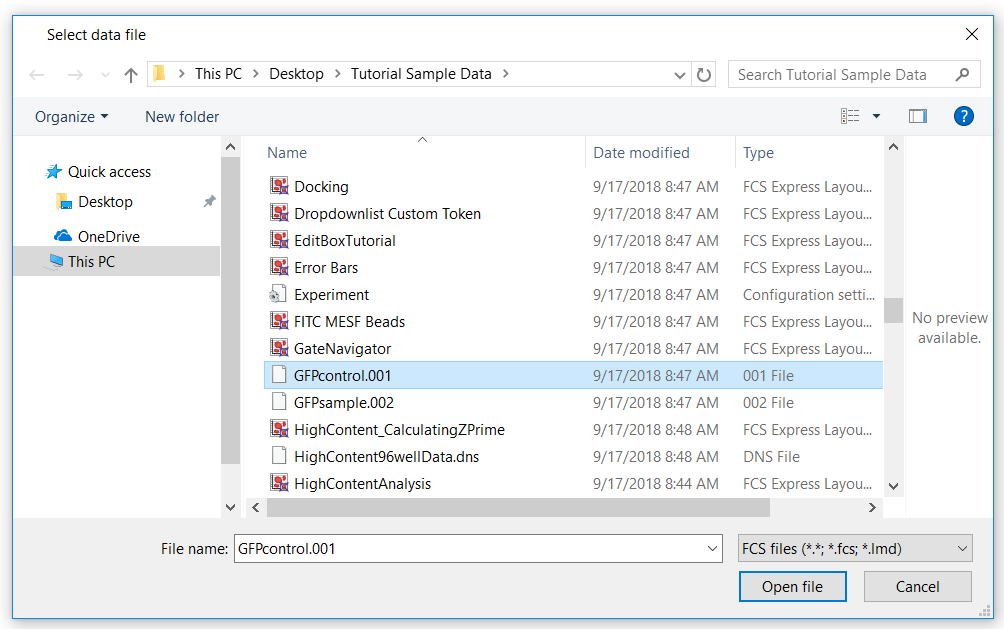
A Select data file dialog box will appear (Figure T2.2).

Figure T2.2 Select data file Dialog
3.Navigate to Tutorial Sample Data folder and select the GFPcontrol.001 data file (Figure T2.2).
4.Press the Open file button.
The newly inserted Color Dot plot will now appear in the layout. Plot can be resized by placing the cursor over any of the red handles on the selected plot and adjusting as necessary. Refer to the tutorial on using objects for more information on resizing objects.
Note: when inserting the first plot in the layout, you are prompted to select a file (as described above). If a plot is already present in the layout you won't be prompted, and FCS Express will use the most recent data file when adding a new plot. User Options can be customized to be always prompted to select a data file (see the Always Display Selection Dialog chapter for more details).
Plots can also be inserted using the Data→Save/Load→Open command.
Note: Please save this layout to your desktop if unable to complete the next tutorial section.
