Inserting and Modifying a Token

Contents
Tokens can represent items of many types including: statistics, classifiers, file information, or customized values. You can insert tokens in text boxes. For the following three sections on tokens, the file we will be using is ApoMono.002 found in the Tutorial Sample Data archive.
In the course of this example, we will:
•Insert a token into a text box.
•Modify the formatting of a token.
To insert a token:
1.Select File tab→Open (Figure T3.1).
2.Open the layout TokenInsertion.fey found in the Tutorial Sample Data archive.
3.Left-click after the word "contains" in the text box containing the incomplete sentence "The Gate 'Whole Cells' contains." The text box should change to have a green border, indicating it is in edit mode, and the cursor should be flashing after the word contains. Add a space.
We will be completing this sentence with the statistic # of Cells for Whole Cells gate.
4.Right-click inside the selected text box where the cursor has been placed at the end of the phrase from step 3 above.
5.Select Insert Token from the pop-up menu (Figure T5.23).

Figure T5.23 Inserting a Token
You can also insert a token using the Text tab→Insert Text group→Insert Token command from the Ribbon Bar.
The Insert a Token dialog will appear (Figure T5.24).

Figure T5.24 Insert a Token Dialog
6.Click Statistic to select if necessary.
7.Click Insert button at the bottom of the dialog.
A Create Statistic dialog will appear with the Data Source category displayed (Figure T5.25). There is no need to change the data source since it is already showing the source as the FSC vs. SSC plot for ApoMono.002 data file.
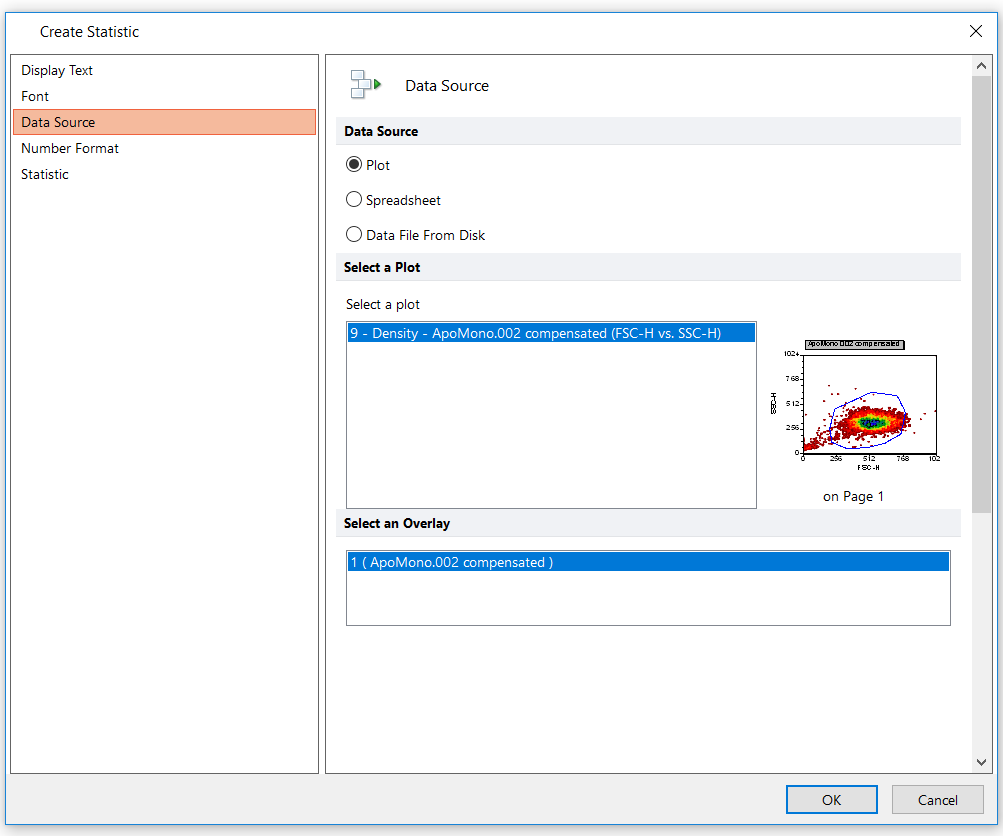
Figure T5.25 Create Statistic Dialog--Data Source Category
8.Click on the Statistic Category of the Create Statistic dialog (Figure T5.26).
The Statistic page of the Create Statistic dialog will now appear.

Figure T5.26 Create Statistic Dialog from Right-Click and Insert Token Command-Statistic Category
We will select the statistic we want the token to display (Figure T5.26).
9. Select # of Events in the Statistic list box (Figure T5.26).
10. Select Whole Cells from the Gate list box (Figure T5.26).
11. Click OK.
The statistic (# of events) appears in the text box after the text 'The Gate Whole Cells contains' and will be highlighted in grey whenever the text box is in edit mode (green border). The grey background is to show that the text is a token, not free text, and cannot be directly edited.
12. Push the "space" bar key and type 'events.' in the text box after the token to complete the sentence.
The text box should now resemble Figure T5.27. The token will appear with the same text settings as the text already in the box.

Figure T5.27 Text Box with Token
Note: Tokens can also be inserted into tables.
You can format the font of a token identically to the way you format the font for normal text, described above. Figure T5.28 shows the same text box as Figure T5.27 except the font was changed to Courier New, 15pt, and Bold. For more help on changing text in text boxes, see the section on Formatting Text in a Text Box.

Figure T5.28 Formatted Token Font
Tokens can also be inserted by dragging and dropping the plot onto the text box.
To insert a Token by Drag and Drop:
First, we need to delete the token in the text box.
13. Highlight "7525 events." in the text box.
14. Hit the Delete key to delete the token.
15. Left-click on the border of the SSC-H v FSC-H ApoMono.002 plot. The border of the plot should turn green.
16. Left-click on the green border. The border of the plot should turn red to indicate it is in selected mode.
17. Click and hold the red border. While holding down the left mouse button, drag the cursor (Figure T5.29) to the space after the word "contains" in the text box.
18. Release the mouse button to drop the plot into the text box.
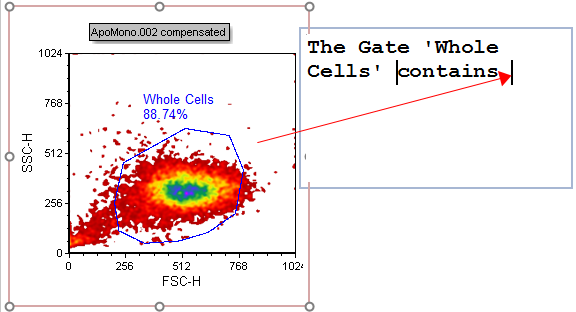
Figure T5.29 Dragging Token from Plot onto Text Box
The Paste Special dialog will appear (Figure T5.30).
19. Select Statistic Token from the Paste Special dialog (Figure T5.30).
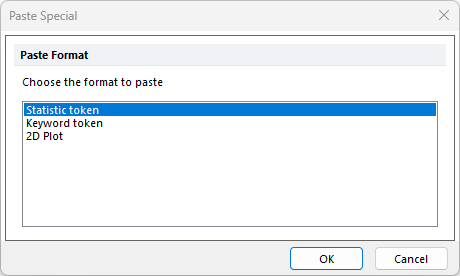
Figure T5.30 Paste Special Dialog
20. Click OK
The Create Statistic dialog will now appear with the Statistic category open (Figure T5.31)

Figure T5.31 Create Statistic Dialog from Drag and Drop-Statistic Category
21. Select Whole Cells in the Gate list box (Figure T5.31).
22. Select # of Events from the Statistic list box (Figure T5.31).
23. Select OK.
The number of events will now be inserted as a token, highlighted in grey, after the word "contains" in the text box (Figure T5.29).
24. Click after the number of events token (highlighted in grey) in the text box.
25. Push the space bar key and type "events." to complete the sentence in the text box.
The text box will appear as in Figure T5.32.

Figure T5.32 Completion of Inserting Token
Select File tab→Close to close this layout with or without saving as you prefer.
In the next example, we will creating a custom token.