Snapshots Window
In this tutorial:
•We will learn how to take Snapshots through the use of the Manual Snapshots navigator.
•We will learn how to apply Snapshots to the data in the layout.
•Although any data files of your own can be used to follow along in this tutorial, you have the option of using the same sample data files used in this tutorial. The sample data files are located in the Tutorial Sample Data archive.
1. Navigate to the Tutorial Sample Data folder from the File tab→Open.
2. Open the layout SnapshotWindow.fey.
This layout contains 2 color dot plots, 2 density plots and a 1D histogram. Three data files are loaded into the Data List, which is docked to the right side of the layout. We will navigate and analyze through these 3 files and make adjustments to the gates, quadrants, and markers used to analyze the data. Once we adjust the various gates, we will take a snapshot.
3. Open the Snapshots navigator from Batch & Export tab→Snapshots group→Manual Snapshots command  .
.
We will begin by taking a snapshot of the current state of the layout.
4. Click on the Create a new Snapshot button ![]() in the Manual Snapshots navigator.
in the Manual Snapshots navigator.
5. Replace the text "New Snapshot" with "Baseline" in the Snapshot name text area.
Once the snapshot is taken, FCS Express will show a time stamp for that snapshot (Figure T9.2).
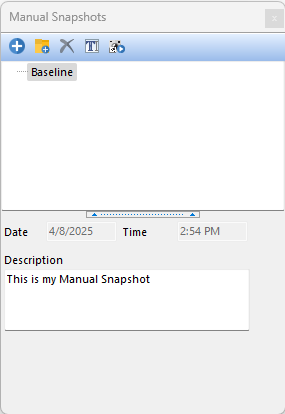
Figure T9.2 Baseline Snapshot with a Timestamp
6. Navigate to the next iteration by clicking on the radio button next to Iteration 2 in the Data List, as seen in Figure T9.3.
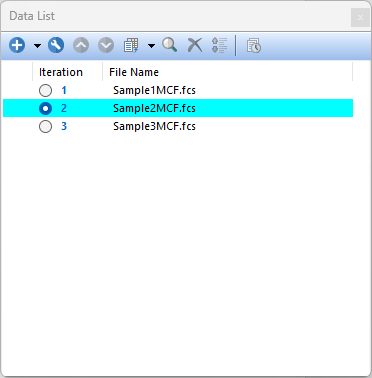
Figure T9.3 Navigate to the Next Iteration By Clicking on Iteration Number 2
The steps below are highlighted in Figure T9.4.
7. Adjust the Red gate to include the majority of the cells in the cluster. (Figure T9.4, ![]() )
)
8. Right-click the BV605 vs BV421 plot. (Figure T9.4, ![]() )
)
9. Select Show Quadrants.
10. Move the quadrant in the APC-H7 vs APC plot to a new position. (Figure T9.4, ![]() )
)
11. Adjust the Marker on the 1D histogram of APC. (Figure T9.4, ![]() )
)
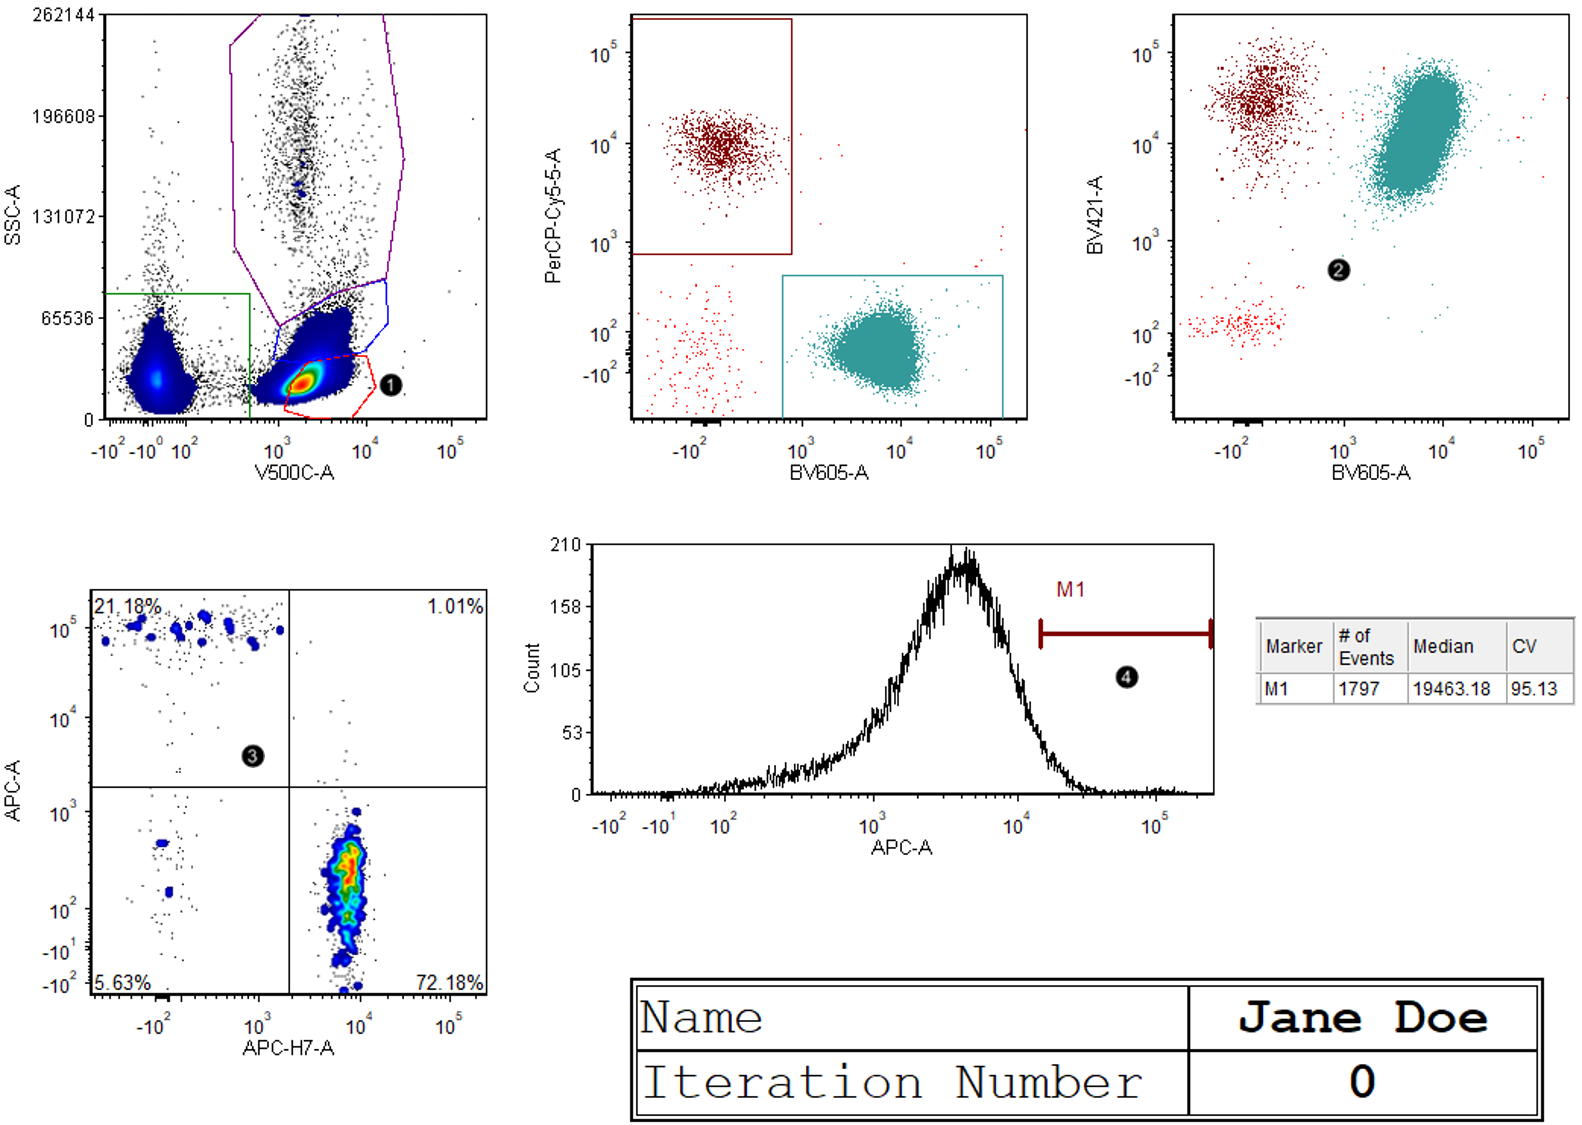
Figure T9.4 Before Adjusting Gates
After adjustments, the layout should resemble Figure T9.5.
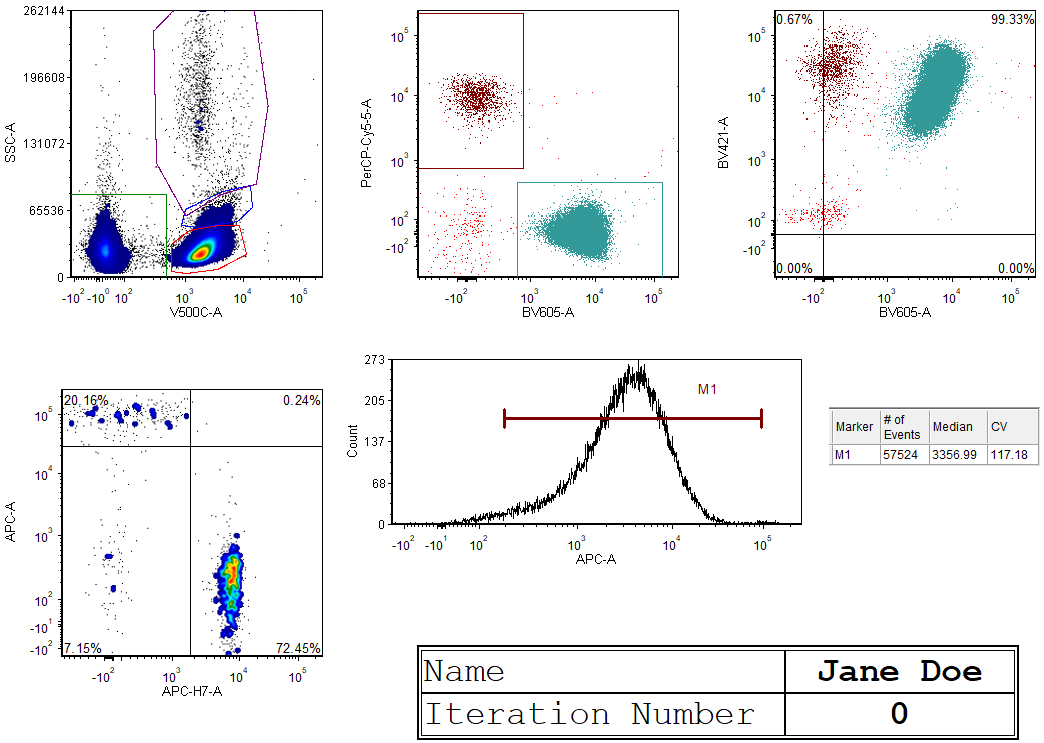
Figure T9.5 After Adjusting Gates
12. Repeat Step 4 to record a new Snapshot.
13. Replace the text "New Snapshot" with "Adjusted" in the Snapshot name text area.
14. Navigate to the next iteration by clicking on Iteration Number 3 in the Data List.
We will now apply the Baseline snapshot from step 5 to Iteration 3.
15. Click and hold the text "Baseline" in the Manual Snapshots navigator to select the snap shot.
16. Drag the "Baseline" Snapshot from the Manual Snapshots navigator to the layout, as seen in Figure T9.6.
Alternatively, you may apply the snapshot by selecting the snapshot as in step 15 and clicking on the Apply Snapshot button ![]() in the Manual Snapshots navigator.
in the Manual Snapshots navigator.
Once the snapshot has been applied, all gates and coordinates captured by that snapshot will be applied to the data. Repeating steps 15 and 16 with the "Adjusted" snapshot will apply that snapshot to the layout (Figure T9.7).
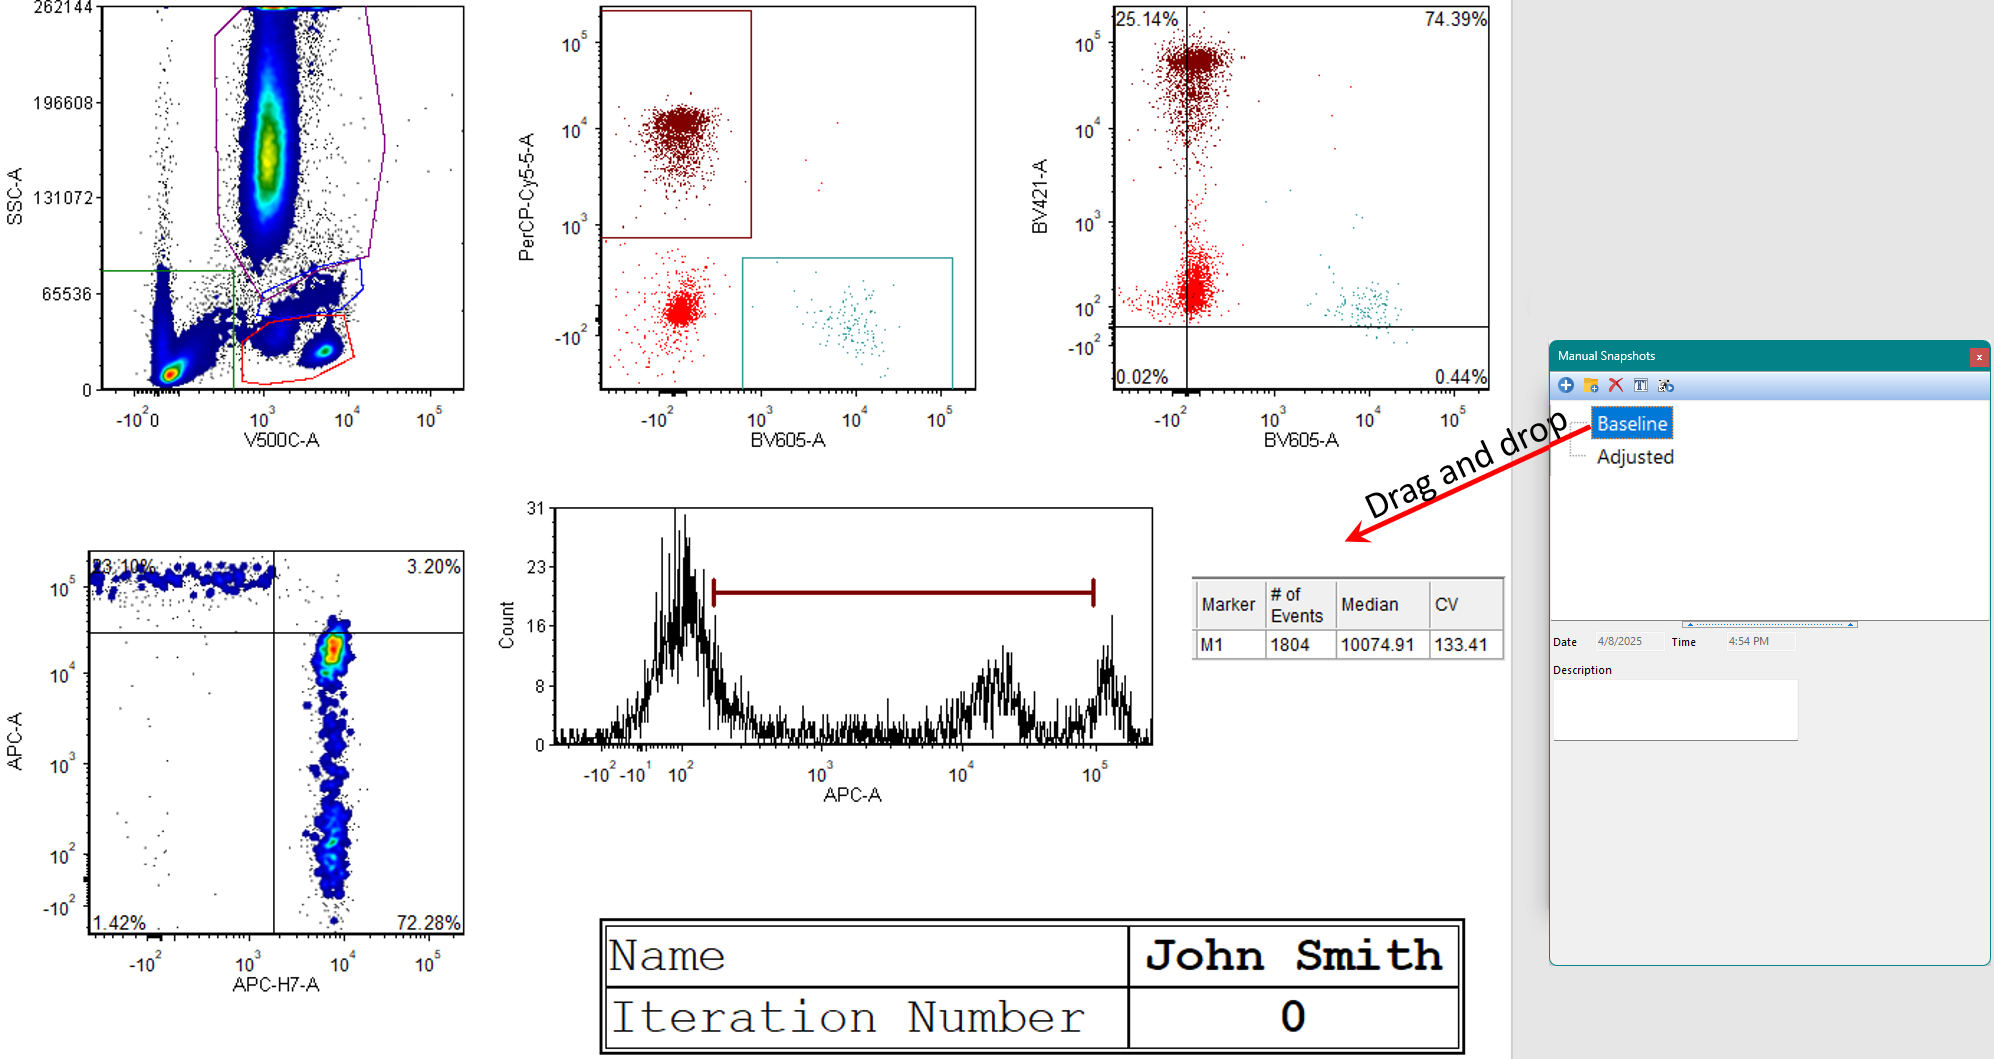
Figure T9.6 Dragging and Dropping the Baseline Snapshot to Apply It to Iteration 3
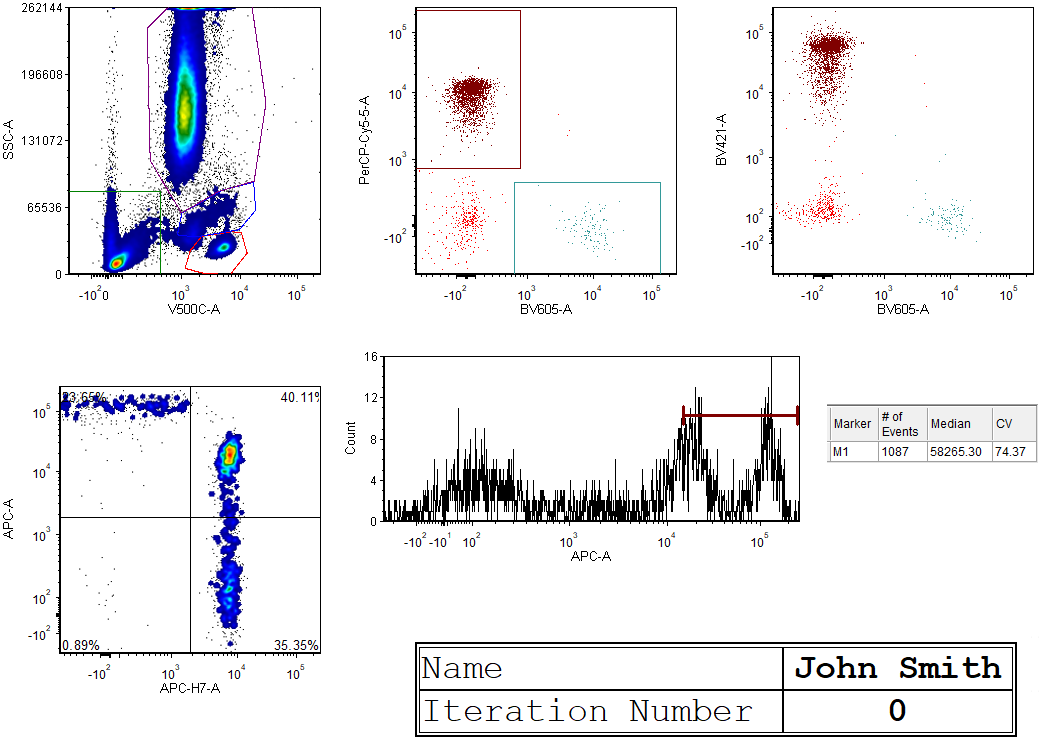
Figure T9.7 Layout after Dragging and Dropping Baseline Snapshot to Apply to Iteration 3
In the next section, we discuss on how to automatically apply snapshots while navigating through each iteration.
