The Multi Plot Tab

Contents
The Multi Plot tab allows you to access multigraph plotting features that enable you to quickly insert an array of plots for many parameters. To access this tab, a plot must first be selected.
Note: The Multi Plot tab feature is not compatible with Subtraction plots, Picture plots, Bar and Pie Charts, Scatter plots, Scatter with Regression plots, Heat Maps and gates Heat Maps.
•Multigraph - Please see our full description and examples of working with multigraphs.
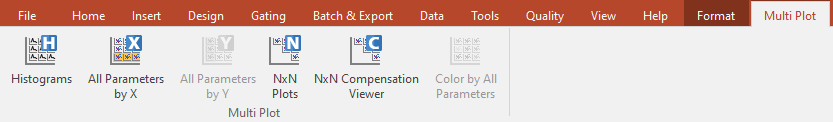
oHistograms: The Histograms option will insert 1D histograms of every parameter in the data set
oAll Parameters by X: The All Parameters by X option will insert the 2D plot type of the parent plot with the X axis of the parent plot consistent across all plots. The Y axis will change for each parameter in the data set.
oAll Parmaeters by Y: The All parameters by Y option will insert the 2D plot type of the parent plot with the Y axis of the parent plot consistent across all plots. The X axis will change for each parameter in the data set
oNxN Plots: The NxN Plots option will create multigraphs that display combinations of all parameters (including time and scatter) versus each other.
oNxN Plots Compensated: The NxN Plots Compensated option will create multigraphs that display combinations of all parameters versus each other of the parameters involved in the compensation matrix of the parent plot.
oColor by All Parameters: The Color by All Parameters option will create multigraphs that display plots with the color based on parameter set for each parameter chosen. Color by All Parameters is accessible when the source plot is either a density plot or a contour plot. It is especially useful when performing tSNE styled analysis when it is useful to show color based on parameters when the axis are set to tSNE X vs tSNE Y.