创建条形图
本章节中,我们将学习利用自定义数据网格中的数据来填充条形图。请参见我们的Bar Plots webpage(条形图网页)来查看附加视频和创建条形图的小技巧。
| 1. | 选择File(文件)标签→Open(打开)。 |
此版面包括彩色点状图和一个自定义数据网格,条形图将由该自定义数据网格中的数据得到(图1)。要了解如何在版面中添加自定义数据网格,请参见“在版面中添加自定义数据网格”章节。
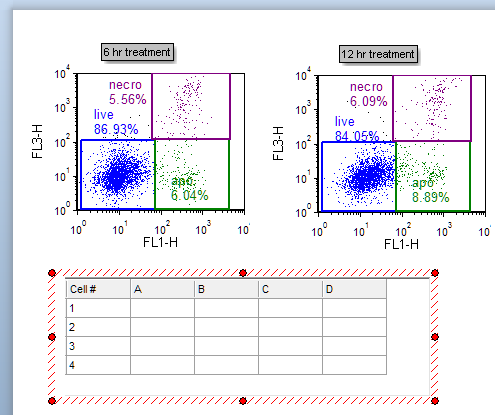
Figure 1. Custom Data Grid on the layout
| 我们现在将有自由文本和实时更新标记对自定义数据网格进行填充。首先,我们将手动输入自由文本值,来作为我们条形图的坐标轴标签。 |
| 3. | 在自定义数据网格中,点击单元格A1,让其高亮显示(图2)。 |

Figure 2. Entering freetext into a Custom Data Grid
| 4. | 请在自定义数据网格公式编辑器中输入"live"(图2 |
| 5. | 点击自定义数据网格公式编辑器中的绿色复选标记(图2 |
| 6. | 重复第3-5步骤,来为自定义数据网格中的单元格A2和A3分别输入"apo"和"necro"。 |
此时自定义数据网格将出现,如右图2所示。我们将在条形图或者饼状图上选择统计标记,然后把它们放在自定义数据网格中。使用标记,能让绘图根据您对门或者数据集的调整,进行实时更新。
| 7. | 请从左上角的绘图“6 hr treatment”中拖拽"live"门到自定义数据网格的B1单元格中。拖拽时,该门的边框将移动(图3 |
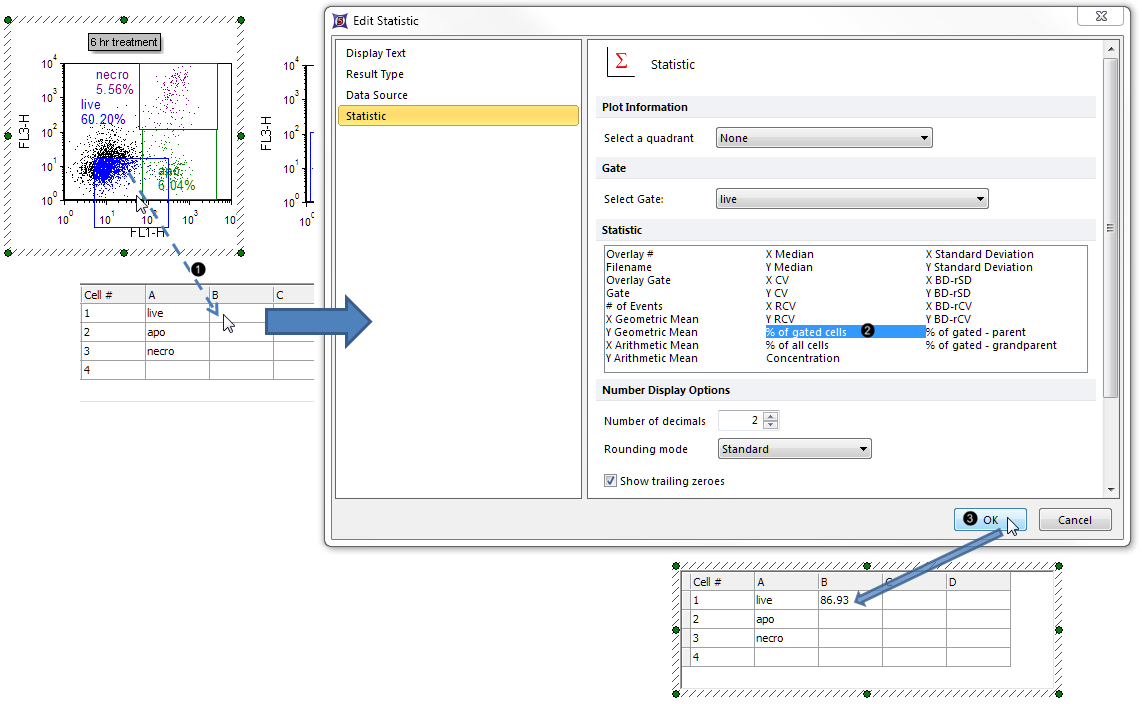
Figure 3. Dragging and dropping a statistic token into the Custom Data Grid.
| 8. | 请从Edit Statistic(编辑统计)对话框中的Statistic(统计)列表框中选择% of gated cells(门中细胞百分比)(图3 |
| 9. | 点击OK(图3 |
此时,自定义数据网格的B1单元格将包含"live"门的%-gated(门中细胞百分比)统计数据,如图3所示。
| 10. | 重复第7-9步,将“6 hr treatment”绘图中的"apo"和"necro"门分别拖拽到自定义数据网格的B2和B3单元格中。此时自定义数据网格将出现,如图4所示。 |
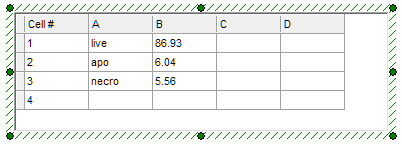
Figure 4. Custom Data Grid with B column filled with %-gated statistic tokens
注意:可直接拖拽统计、门或者绘图到条形图中,来完成步骤1-10,而不通过使用自定义数据网格。要了解详情,请参见手册中“图形指南”章节。
| 11. | 请选择Insert(插入)标签→ 1D Plots(一维绘图)→ Bar(条形图)命令(图5)。 |

Figure 5. Inserting a Bar Plot
| 12. | 在版面上一空白处点击(例如在自定义数据网格的右边点击)来插入条形图(图6)。 |
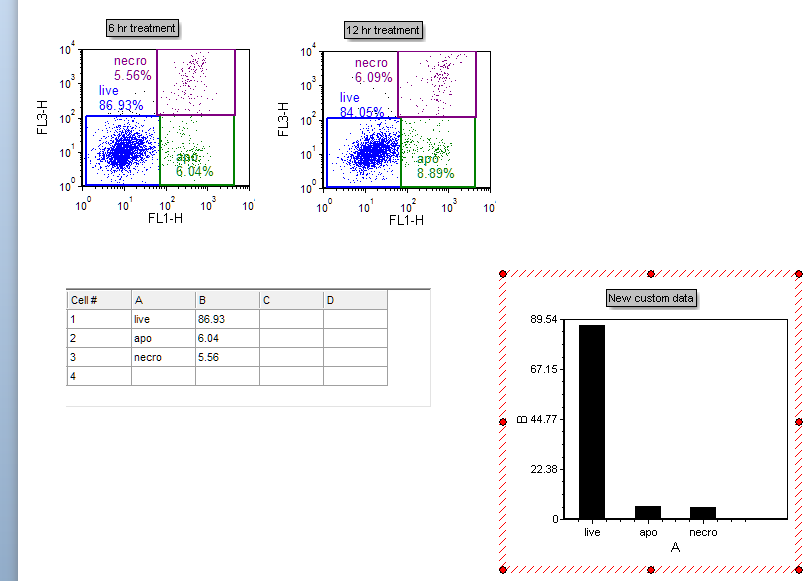
Figure 6. Bar Plot inserted on the layout
| 13. | 请在自定义数据网格第四行中任意空着的单元格中点击鼠标左键,让它高亮显示为蓝色(图7)。 |
| 14. | 在第四行高亮显示的单元格中右键点击,然后从弹出菜单中选择Delete(删除)→Selected Rows(所选行)(图8),来删除条形图中"necro"下面的空着的X轴区域。 |
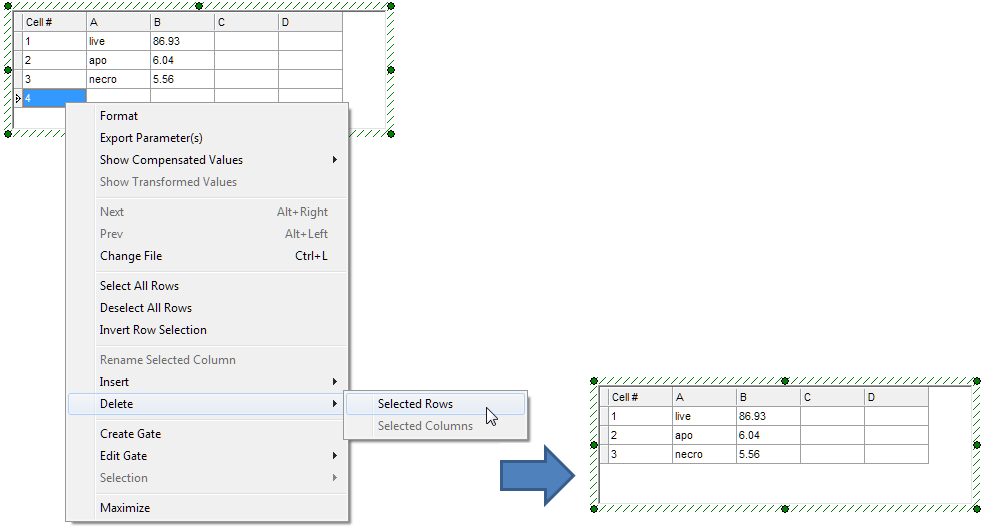
Figure 7. Deleting an empty row from the Custom Data Grid
现在,空着的行就被删除了(图7所示)。
注意:当插入一个自定义数据网格时,行和列的数目可根据您的意愿来指定。如第13-14步一样,也可在任意时间对行和列进行添加和删除。
| 15. | 点击"A"列中的一个单元格,让其高亮显示。 |
| 16. | 点击鼠标右键,然后从弹出菜单中选择Rename Selected Column(为所选列重命名)(图8 |
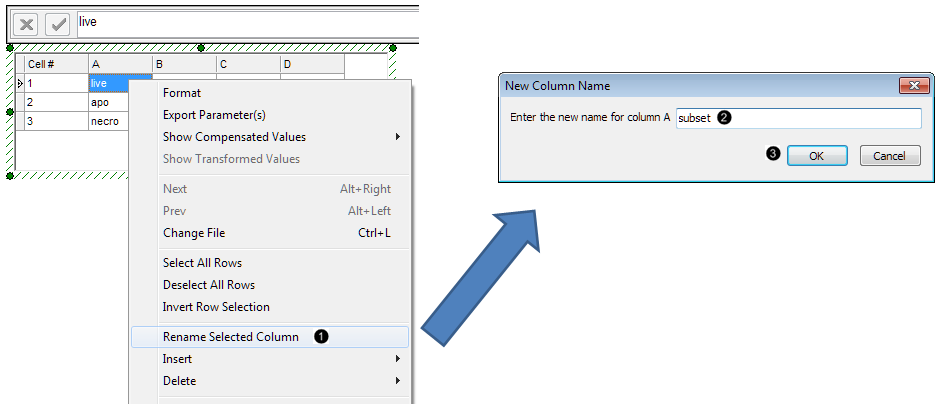
Figure 8. Retitling a column in the Custom Data Grid
| 17. | 请在New Column Name(新列名)对话框中输入"subset"(图8 |
| 18. | 点击OK(图8 |
| 19. | 为"B"列重复第15-18步,输入"%-gated"来为条形图的Y轴重命标题。 |
此时,条形图和与此关联的自定义数据网格将出现,如图9所示。
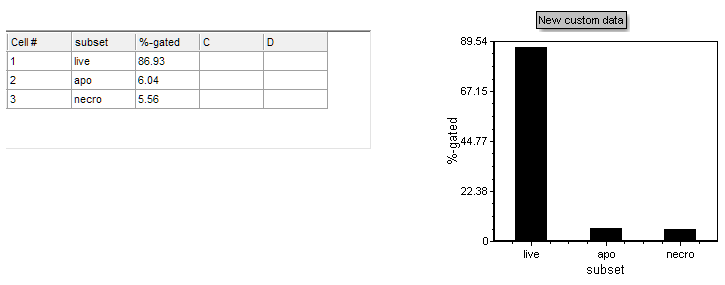
Figure 9. Completed Custom Data Grid and its associated Bar Plot
注意:通过直接在绘图上点击条形图的数据条,可自定义每个数据条的标签。除此之外,也可自定义条形图的彩色条、类型和其他属性。要了解更多详细信息,请参见“格式化条形图”章节。
| 20. | 自选操作: |
| • | 点击Data(数据)标签→Change Data on All(修改所有数据)→ Next/Previous(下一项/前一项)按钮,通过设置Data List(数据列表)中的文件及观看条形图新数据的更新来向前发展。 |
| • | 在绘图上调整门的位置,您就会看到条形图会实时更新。 |
下一章节,我们将用相同的行数据来创建一个饼状图。或者直接来到“格式化条形图”章节。
