Applying a tSNE Transformation(应用tSNE(t-分布邻域嵌入)转换)
一旦一个tSNE(t-分布邻域嵌入)转换被预设好,就可应用于任何FCS Express中的绘图。一旦绘图应用了tSNE(t-分布邻域嵌入)转换,标准化门和数据统计可能被用于研究tSNE(t-分布邻域嵌入)转换的结果。
当一个tSNE Transformation(t-分布邻域嵌入转换)被应用后,文本“tSNE mapped”将出现在该绘图的标题中。
tSNE Transformation(t-分布邻域嵌入转换)可能通过如下的几种方式被用于一维图,二维图和/或热图:
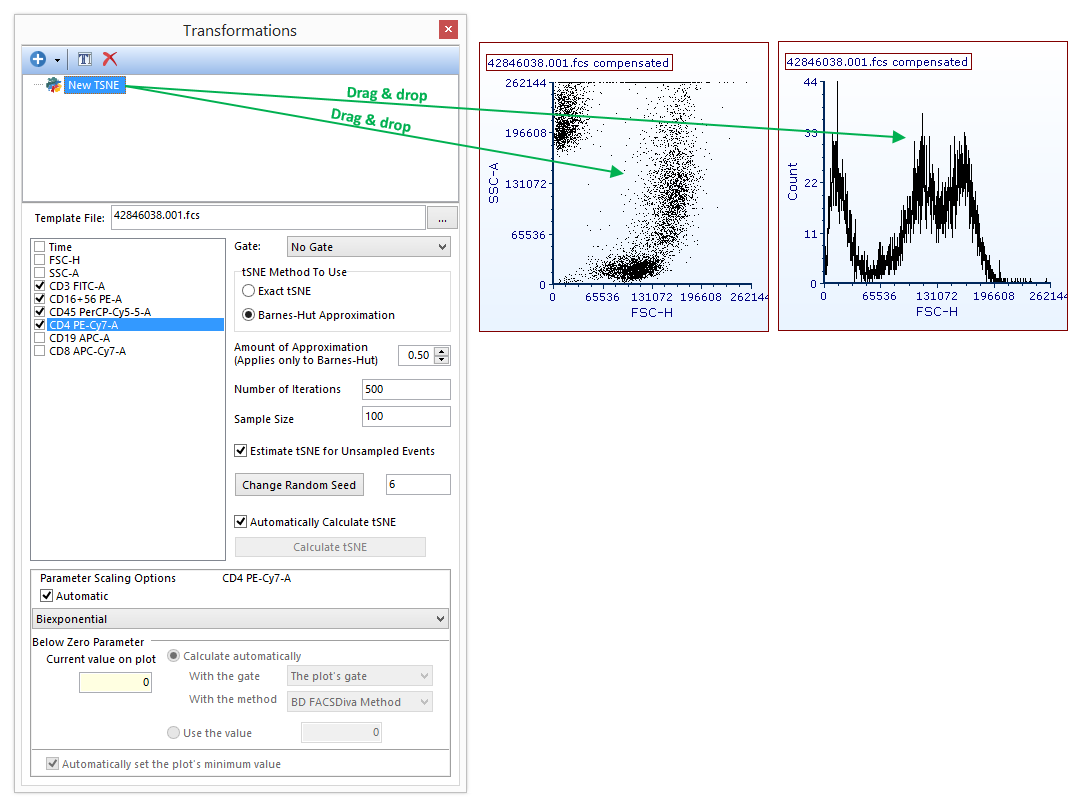
| • | 从转化窗口中拖拽tSNE到目的绘图或者数据网格(图2960)。 |

Figure 29.64 Applying a tSNE transformation to a plot by dragging the tSNE transformation from the Trasnformations navigator to the plot (green arrow).
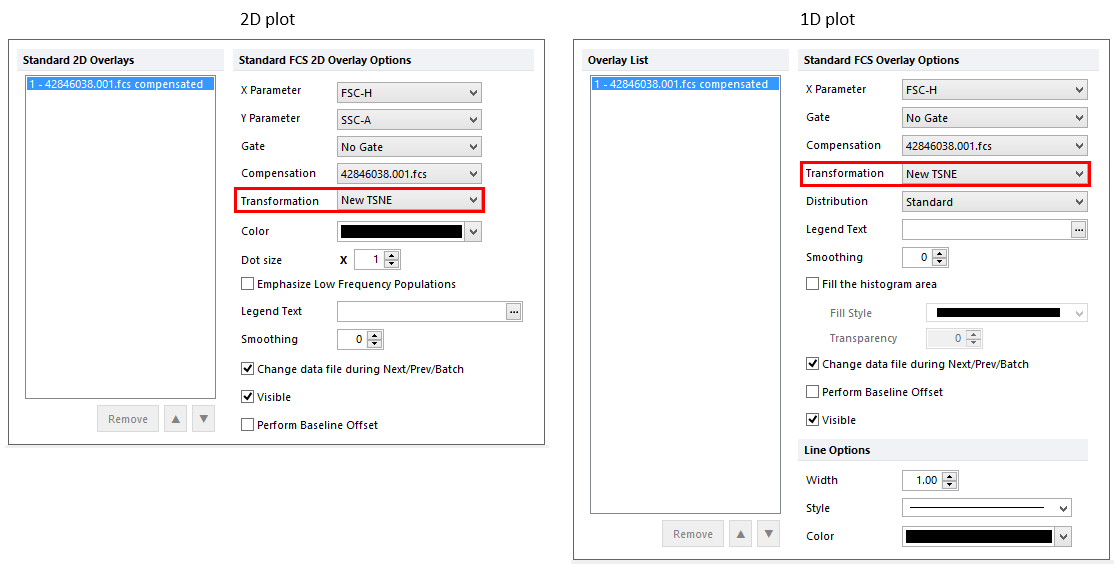
| • | 进入Formatting Overlays(格式化叠加图层)并在Transformation(转换)下拉菜单中选择并应用TSNE Transformation(t-分布邻域嵌入转换)。(图2961)。 |

Figure 29.65. Applying a tSNE transformation to a plot by selecting the tSNE transformation from the Formatting Overlays dialog in the Transformation dropdown.
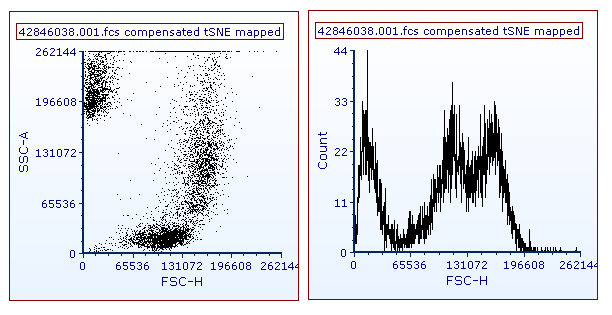
上述2种方法的结果都是在绘图的标题中会出现字样“tSNE mapped”(图29.62)如果想获取tSNE(t-分布邻域嵌入)参数,请点击并且按住绘图的轴并选择合适的tSNE(t-分布邻域嵌入)X或者Y轴的参数。

Figure 29.66. 2D and 1D plot with tSNE transformation applied. Note the "tSNE mapped" suffix in the plot title.
在接下来的章节中我们将会学习如何使用tSNE参数。
