使用tSNE转化
当tSNE转化应用到一个绘图中时,可以通过点击坐标轴标签来进入tSNE转化(图29)63。可以在任何绘图类型中标准或者tSNE参数组合中都可以创建门来特异性选择一个或者多个tSNE群。Jump to Gating tSNE transformed data(跳到门tSNE转化数据)。
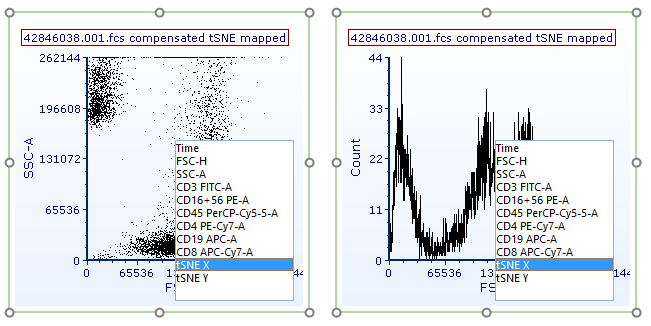
Figure 29.67 tSNE parameters can be accesses as standard parameters.
任何绘图都可以展示基于tSNE的参数,其中Density plots(密度图)和Contour Plots(等高线图)有一个叠加选项叫做Color Based on(基于颜色) (图29)64)可以帮助我们可视化和理解tSNE转化数据集。此Color Based on(基于颜色)选项可以通过Density plots(密度图)和Contour Plots(等高线图)中的Formatting(格式)→Overlays(叠加)进入。此Color Based on(基于颜色)下拉菜单允许选择在密度图和等高线图中展示任何数据集中的可用的参数。
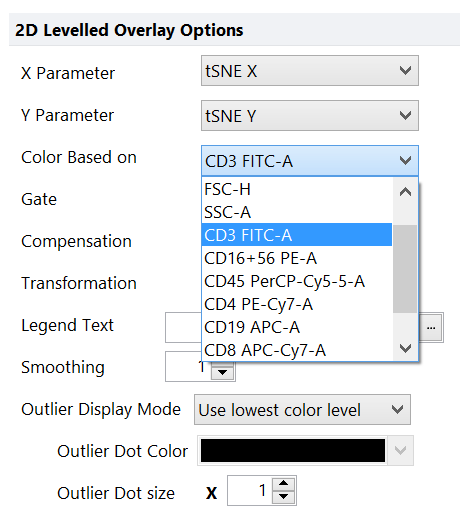
Figure 29.68 - The Color based on option in the formatting>overlays category of density and contour plots allows you to choose a parameter that will be used to display a density or contour map on tSNE X and tSNE Y transformed parameters.
通过tSNE转化数据集在X和Y参数轴上展示tSNE X和tSNE Y值,在基于颜色的部分可以清楚的看见添加的目标参数。在下面的例子中,如左上方绘图所示,同样的tSNE转化在Color Based on(基于颜色)参数下不同的绘图中有3种不同的展示类型。上面的例子显示密度图用火 红色 层次来展示,中间的例子等高线图显示离群,密度图的显示Mean +/- SD(平均±标准偏差)的Style(样式)中绿-黑-红颜色水平。将Standard Deviation(标准偏差)设置成2.00。
注意,FCS Express中,可以在tSNE转换数据里通过独特的方式展示一系列的选项,并且无限组合。下面的列举出的一系列格式选项可以帮助你数据可视化:
在数据层中减少Smoothing(平滑处理)值到0或者1或者减少分辨率可以明显的增强数据可视化。
| • | Overlays(数据层)选择Color Based on(基于颜色)参数来显示或者隐藏离群值和离群值颜色。 |
| • | Color Levels(颜色层次)选择密度图和等高线图中的全部颜色方案和颜色层级属性。 |
| • | Specific Options(特殊选项)选择绘图的分辨率,也可以选择 Shade Based on Density(基于密度的阴影)选项。 |
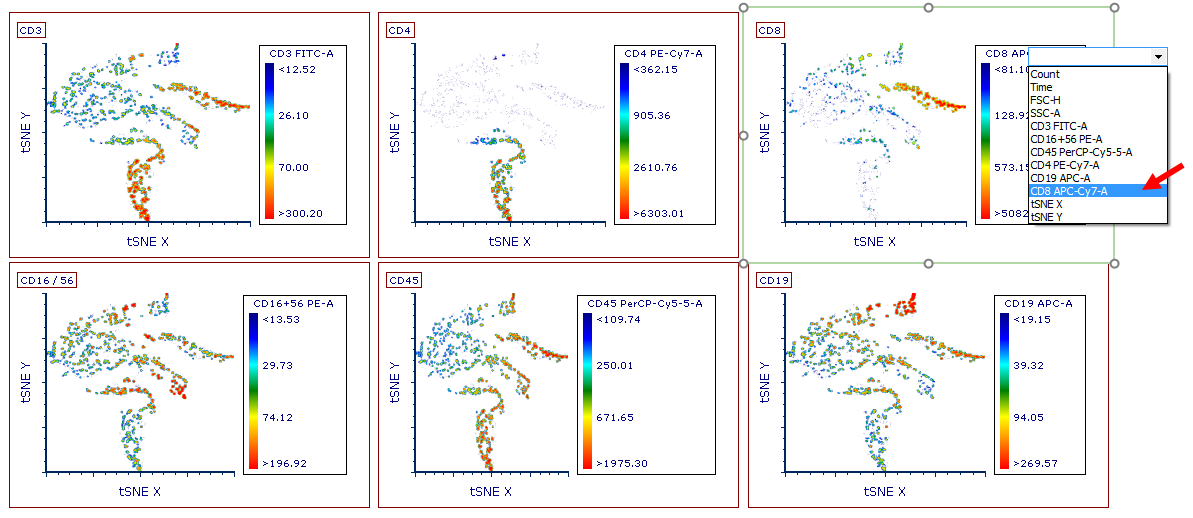
Color Based on parameter indicated in the upper left of the plot. Example above shows Density plots with the Flame Color Level.
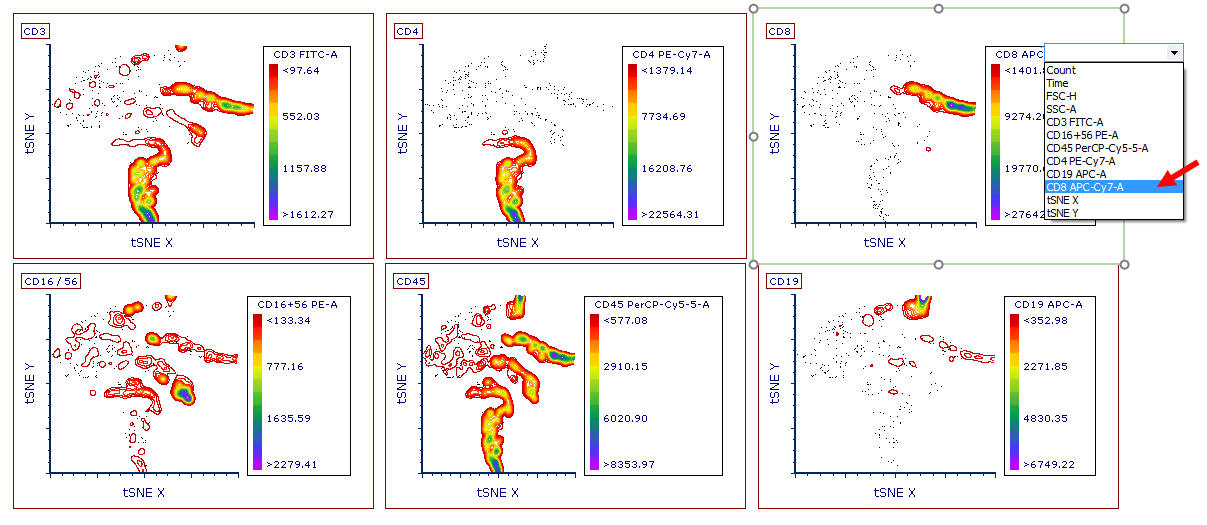
Color Based on parameter indicated in the upper left of the plot. Example above shows Contour plots with outliers enabled.
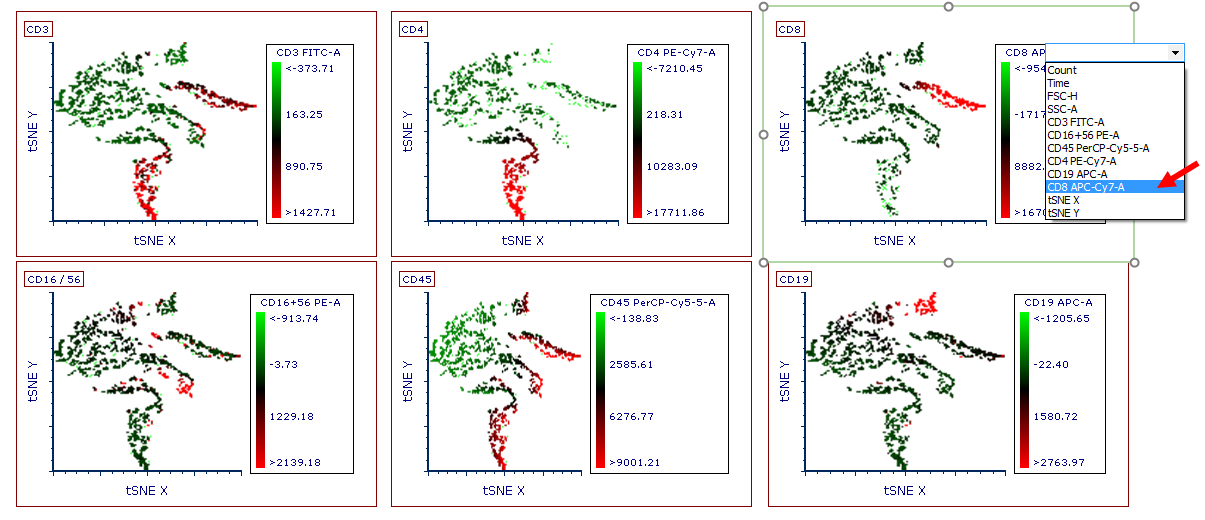
Color Based on parameter indicated in the upper left of the plot. Example above shows Density plots with Green-Black-Red Color Level with a Style of Mean +/- SD and Standard Deviations set to 2.00.
在任何绘图类型中标准或者tSNE参数组合中都可以创建门来特异性选择一个或者多个tSNE群。门也可以用来在任何tSNE转换绘图中反圈门。
以下的图中展示在tSNE参数上画门,拖拽和反圈门(图2965)。
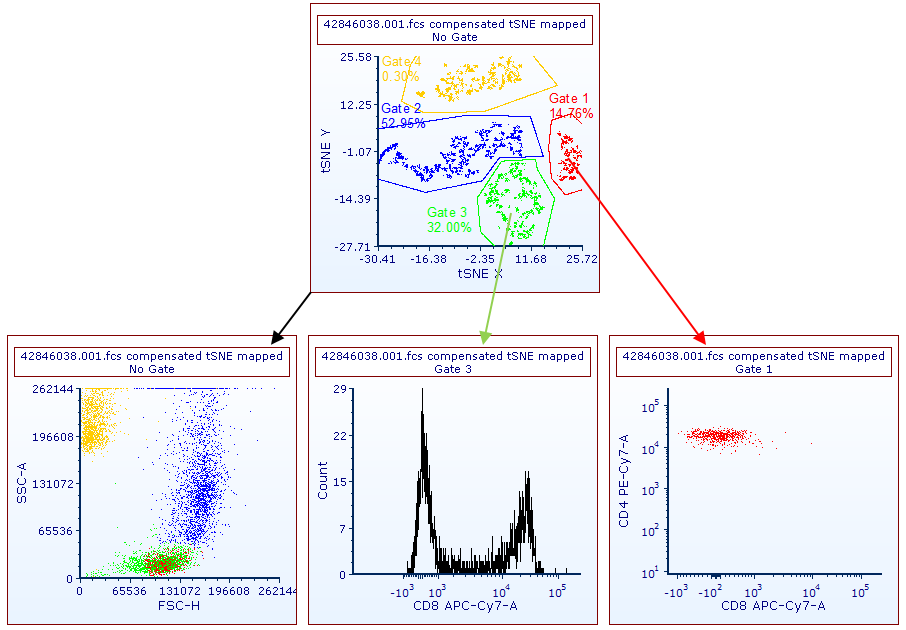
Figure 29.69. Gates have been drawn on tSNE parameters (upper panel) and have been displayed (lower left plot) or applied (lower central and lower right plots) to other plots.
