用ImageJ分析和输出个体图片结果
本章节中,我们将学习如何从ImageJ中分析和输出个体图像结果。方法是使用DNSMacroExample(在一个文件夹中一组单一独立的图像:使用案例)。我们将使用来自教程样本数据集→ImageJ教程文件夹中宏和图片。DNSMacroExample.ijm宏将和单一图片分析文件夹中的图片(DNAImage1.jpg and DNAImage2.jpg)一起使用。
注意: 本章节的焦点不是如何创建宏或者使用ImageJ。本章节的焦点是如何使用De Novo Software提供的宏。要详细了解ImageJ,请参见ImageJ网站(http://rsbweb.nih.gov/ij/index.html)或者写邮件给ImageJ.
| 1. | 打开ImageJ。 |
| 2. | 在ImageJ中安装DNSMacroExample。 |
当这个宏文件被安装到ImageJ中(Plugins(插件)→Macros(宏)→Install(安装))后,三色斑点按钮带有“De Novo Software Exporter(De Novo Software出口商)”按钮。 (一个带有三色斑点按钮的红色矩形,带有"De Novo Software Exporter"提示)的将显示在工具栏中(图T28.97)。

FigureT28.97. The ImageJ tool bar with the DNSMacroExample.ijm macro installed. Notice the red rectangle with three color blobs button that indicates the De Novo Software Exporter.
| 3. | 点击三色斑点按钮带有“De Novo Software Exporter(De Novo Software出口商)”按钮(图T28.97)。 |
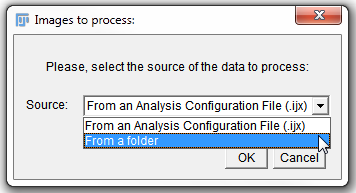
| 4. | 点击Source(来源)下拉按钮(图T28.98)。 |
| 5. | 从弹出菜单中选择From a folder(来自一个文件夹)”(图T28.98)。 |

Figure T28.98 Selecting Images to process from a folder in ImageJ.
| 6. | 点击OK. |
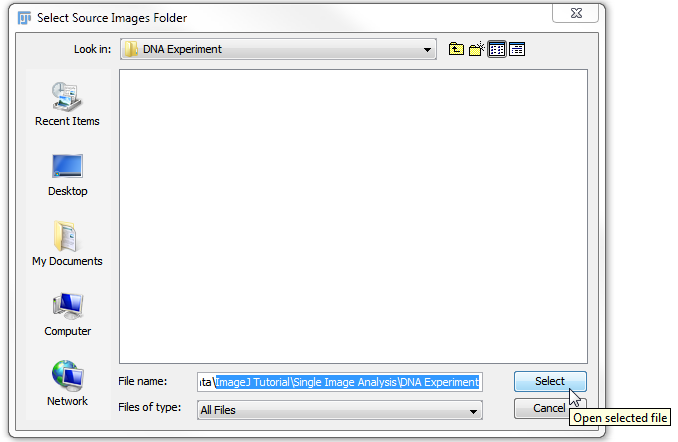
| 7. | 选择Tutorial Sample Data folder(教程样本数据文件夹)→ImageJ Tutorial(ImageJ 教程)→Single Image Analysis(单一图片分析)下,选择Tutorial Sample Data folder(教程样本数据文件夹)→ImageJ Tutorial(ImageJ教程) →Single Image Analysis(单一图片分析). |
| 8. | 点击选择(图T28.99). |

Figure T28.99 Selecting the DNA Experiment folder which contains our images of interest and pressing select.
现在,ImageJ将自动处理Single Image Analysis(单一图片分析)文件夹中的所有图片。将根据定制的宏的函数来处理图片,在宏的最后一行有以下文本:
// - - - - - - - - - The functions below this line are the ones that the user can customize (这条线以下的功能,用户可以自定义)- - - - - - - - - - -
这将包含阈值和对象的识别/分隔。要详细了解自定义宏和调整ImageJ的设置,请参见ImageJ网站(http://rsbweb.nih.gov/ij/index.html)或者写邮件给ImageJ.
导出的.ijout文件将被命名为DNAImage1.ijout和DNAImage2.ijout。包含其他导出信息的两个文件夹将根据原文件名称来命名(图T28.100)。
注意:.ijout文件的名称和包含结果的文件夹的名称必须一样。来自同一张图片,但因为有多个分段,因此会产生多个.ijout文件和结果文件夹。在不复制图片数据组的情况下,运行同一原始图片组的多个分段也是可行的。

Figure T28.100 The Single Image Analysis folder after processing the images. There will be separate .ijout files for each image and folders that contain the results and masking files.
我们现在将用FCS Express打开导出的数据。
| 9. | 打开FCS Express Image Cytometry. |
| 10. | 点击Insert Tab(插入标签)→2D Plots(二维绘图)→Dot(点状图). |
| 11. | 在版面上的任何位置点击,来插入点状图。 |
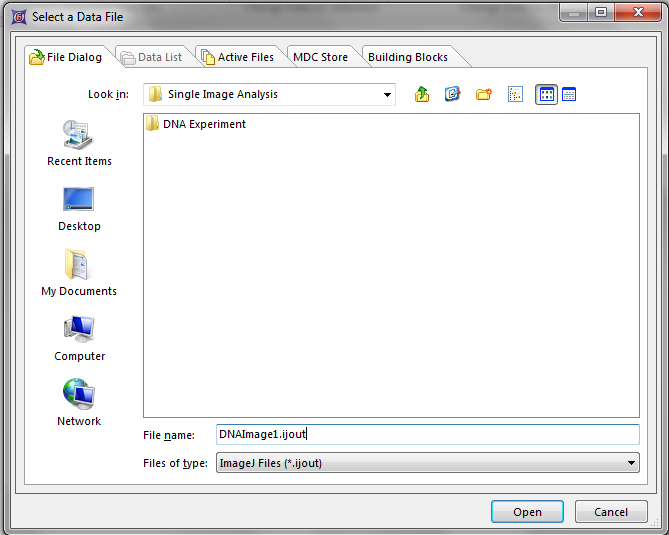
| 12. | 从弹出菜单中选择Files of type(文件类型)从式下拉式菜单中选择 "double negative(双阴性)"。 |
| 13. | 导航到Tutorial Sample Data folder(教程样本数据文件夹)→ImageJ Tutorial(ImageJ教程) →Single Image Analysis(单一图片分析)文件夹。 |
| 14. | 从弹出菜单中选择DNAImage1.ijout. |
| 15. | 点击Open(打开). |
| 16. | 点击Insert Tab(插入标签)→2D Plots(二维绘图)→Picture Plot(图片绘图). |
| 17. | 在版面上的任何位置点击,来插入图片绘图。 |
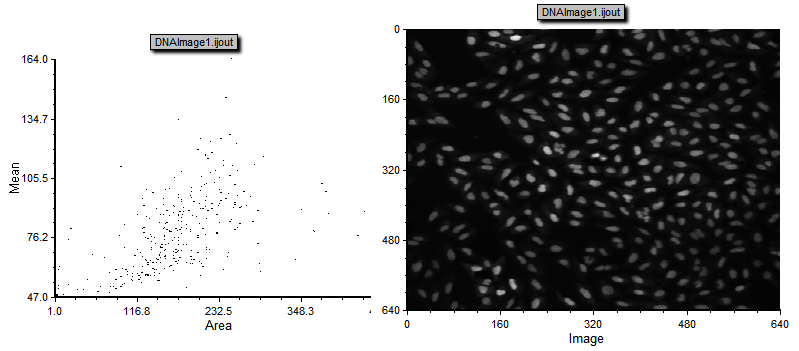
现在版面应该包含来自ImageJ导出数据的点状图和图片绘图(图T28.101)。(使用Next(下一步)和蓝色箭头和Previous(前一项),来更改处理过的来自第一和第二个图片间的数据。要详细了解FCS Express中一起使用绘图和图片数据,请参见下面列出的更多资源教程。

Figure T28.101 A dot plot and picture plot that were create from the DNAImage1.ijout file.
更多资源:
