导入数值格式数据
在设置好导出配置以及分析ImageXpress Velos文件数据后,你便可以把数据导入到FCS Express中。
本章节要用到的ImageXpress Velos文件,可在Tutorial Sample Data archive(教程样本数据库)找到.
| 1. | 选择File(文件)→Options(选项)→Data Loading(数据导入)→ImageXpress Velos Options(ImageXpress Velos选项). |
| 2. | 请取消对Load Images(导入图片)复选框的选择。 |
| 3. | 点击OK. |
注意: 在本例中,没有和数据相关的图片。因此,Load Images(导入图片)复选框是否被选中,不会影响数据导入。
此时,ImageXpress Velos数据导入选项看上去应如图T25.11所示。
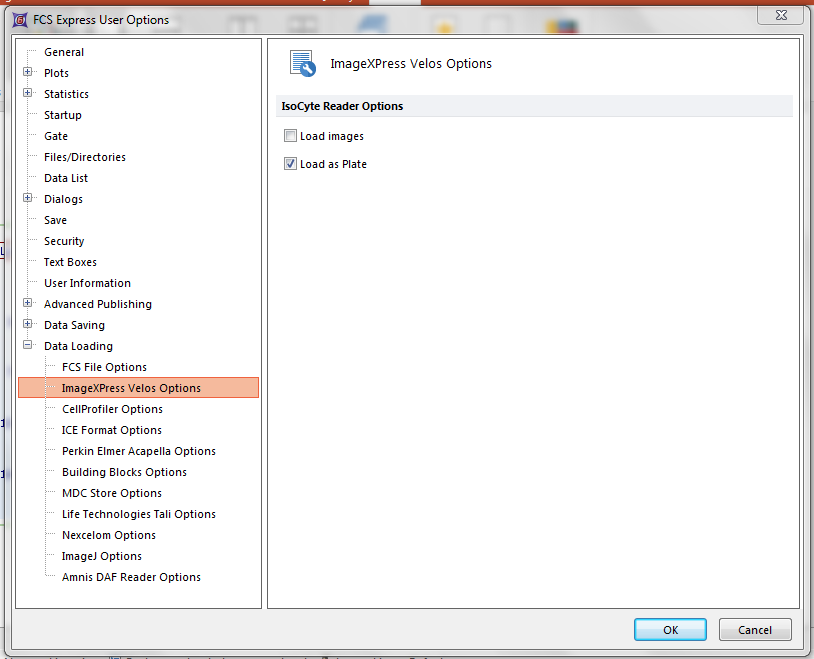
Figure T25.11 IsoCyte Data Loading Options for Numeric Data Only
| 4. | 请选择Insert(插入)→Other Plots(其它绘图)→Heat Map(热图)命令 (图T25.12)。 |

Figure T25.12 Insert a Heat Map
| 5. | 请在版面上任何位置点击。 |
| 6. | 选择ImageXpress Velos files (*.iso)文件类型:从下拉菜单中选择Select a Data File(选择数据文件)类型(T25.13所示)。 |
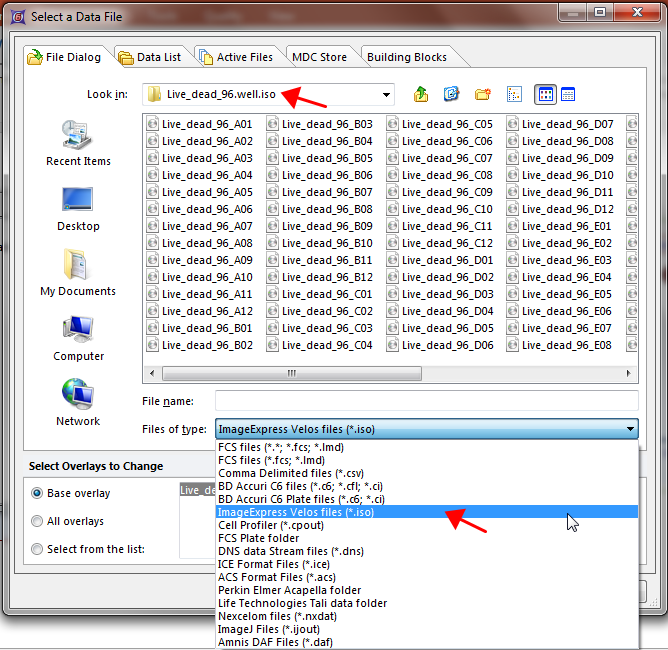
Figure T25.13 Choosing an IsoCyte File for a Heat Map
| 7. | 导航到Sample Data(样本数据)→ImageXpress Velos Without Images(不带图像的ImageXpress Velos)→Live_dead_96.well.iso文件夹。 |
| 8. | 选中Live_dead_96_A01.iso文件。 |
| 9. | 点击Open(打开). |
这时,会出现一个包含你的数据的热图,表明数据被成功导入(图T25.13b)。
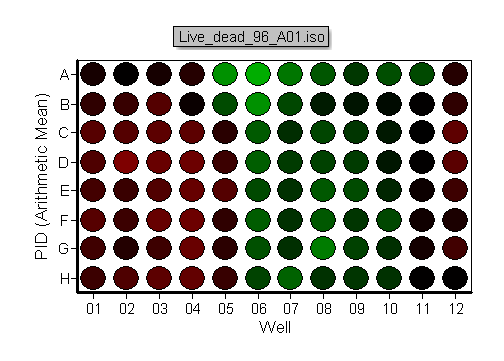
Figure T25.13 The Heatmap of the Live_dead_96_A01.iso file
要查看和每个细胞孔关联的数据
| 10. | 插入一个二维点图通过选择Insert(插入)→2D Plots(2D绘图)→Dot Plot(点图)(图T25.14)。注意: 也可以插入柱状图、点状图、密度图、彩色散点图、轮廓图以及表面绘图。 |

Figure T25.14 Insert a 2D Plot
| 11. | 请在版面上任何位置点击。 |
一个包括数据集中的所有事件为C3孔创建Well Gate(微孔门)将出现在版面上(图T25.15)。
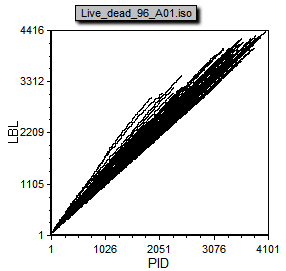
Figure T25.15 Dot Plot created from IsoCyte Data
注意:绘图中默认使用PID对LBL作图,因为这是数据文件中最前面的两个参数。
本例中,我们将把坐标轴更改为I-MEAN1 vs I-MEAN3,以便查看相关数据 (图T25.16)。
| 12. | 请把Y-轴参数修改为IMEAN-1。 |
| 13. | 请把X-轴参数修改为IMEAN-3。 |
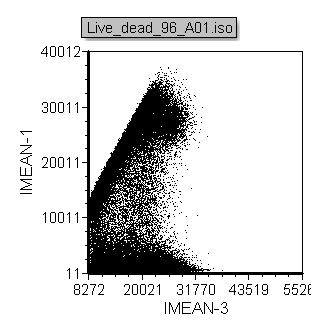
Figure T25.16 Changing the Plot Axes
| 14. | 在您的热图上为C3孔创建Well Gate(微孔门)(图T25.17)。 |
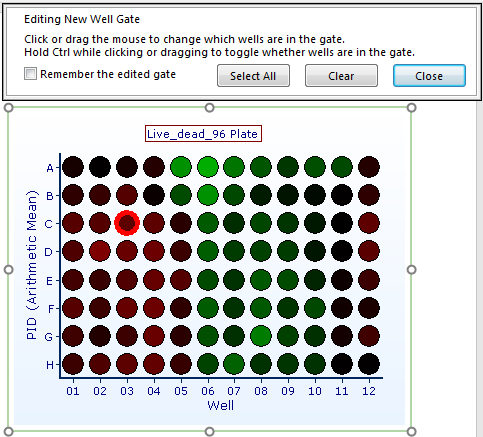
Figure T25.17 Create a Well Gate on the Heat Map
| 15. | 将Well Gates(微孔门)应用到点状图. |
现在,查看最终的数据结果是根据细胞孔门中的数据所绘制(图T25.18)。编辑Well Gates(微孔门)可以选择绘图的不同的微孔或者多个细胞孔,查看最终的数据结果.
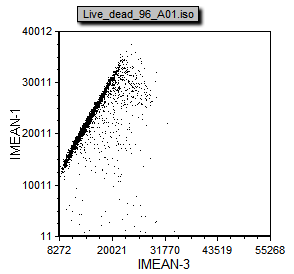
Figure T25.18 Dot Plot Gated by Well
