在回归曲线图中插入数值
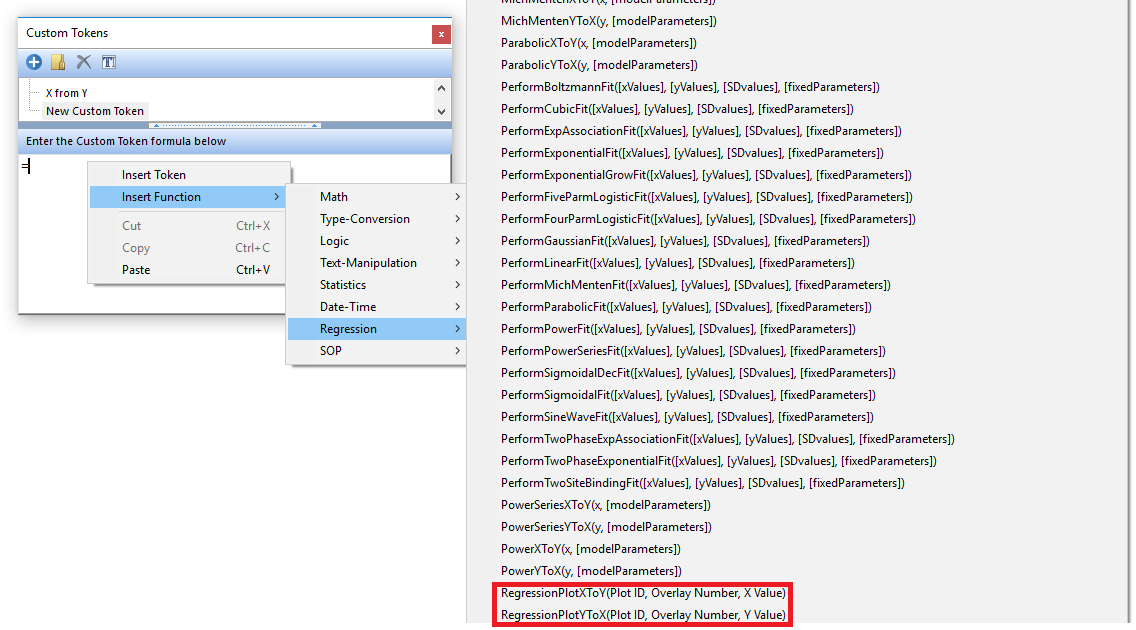
可以使用“回归曲线Y到X”和“回归曲线X到Y”函数,在回归曲线的散点中插入X或Y值。具体操作如下:Custom Tokens(自定义标记)窗口(图1167)或者通过一个Spreadsheet(表格)中的公式见下面内容或者参考文中教程部分来详细了解。

Fig. 11.69 Regression Plot Interpolation Custom Token Functions
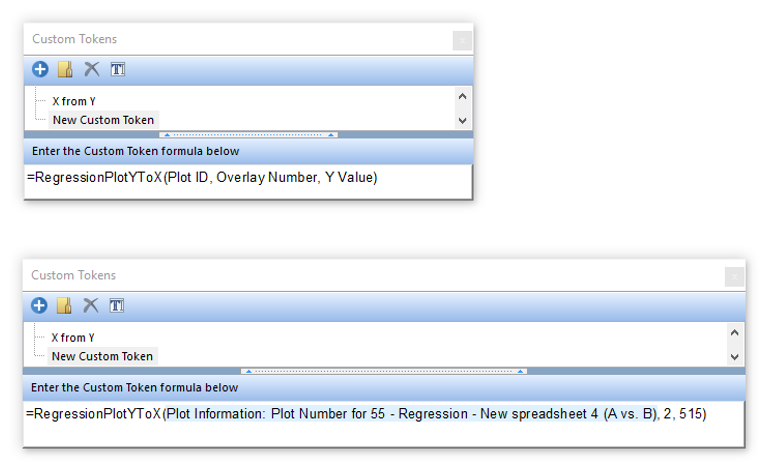
自定义标记的组分是图ID(如图数字标记),(注:overlays是1,所以原始数据是 Overlay #1,第一次回归数据是 Overlay #2)插入的X-或Y-值将用于一个未填写或填写定制的例子中,插入的X-或Y-值将用于一个未填写或填写定制的例子中标记公式如图11所示68,分别在Top(顶部)和底部。

Fig. 11.70 Interpolation Custom Token formula components unfilled (top) and filled (bottom)
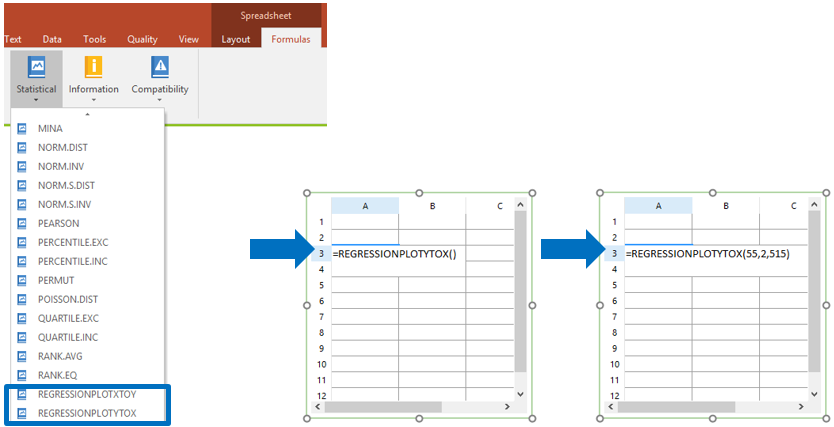
也可以输入一个公式至Spreadsheet(工作表)from theSpreadsheet(工作表)标签→Formulas(公式)→statistical(统计数据)选项组, 的功能如图11所示69.

Fig. 11.71 Regression Plot Interpolation Formula (left) inserted in Spreadsheet (center) and with components filled (right).
