Plot Tokens
Plot Tokens allow you to insert information pertaining to a plot selected as Data Source. To insert a Plot token:
| 1. | Right-click on a Text Box. |
| 2. | Select Insert Token from the pop-up menu. |
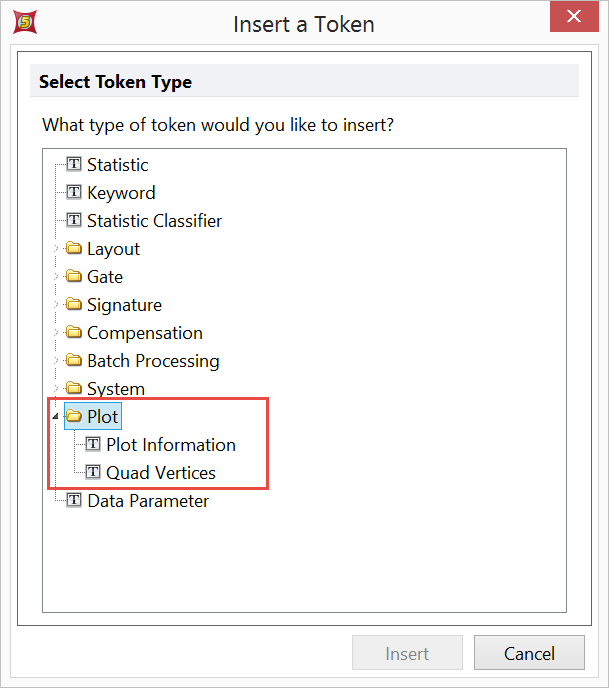
| 3. | Click on the triangle next to Plot (Figure 19.20). |

Figure 19.20 Selecting Plot Token from the Select Token Type dialog
| 4. | Double-click on Plot Information or Quad Vertices. |
| 5. | Choose the desired plot from the Select a Plot list from the Data Source category of the Edit Plot Information Token dialog |
| 6. | Choose the desired token from the list in the Plot Elements or Quad Vertices category, and click OK. |
The available Plot Elements tokens are described below.
Plot Element |
Definition |
Title |
The text within the plot title. |
Footer |
The text contained with the plot footer. |
X Axis Label |
The label used for the X axis within the plot. |
Y Axis Label |
The label used for the Y axis within the plot. |
Plot Number |
The number given to the plot by FCS Express as it is created. |
Plot Description |
An overall description of the plot, showing the Plot Number, Plot Type, the data file name being displayed within the plot, and the X and Y axis parameters for the selected plot. |
Use Channel Calibration? |
Has the Use Channel Calibration on Axes option been selected for that plot? The output is Off or On. |
Is Channel Calibration Applied on X axis? |
A description of whether or not channel calibration has been applied to the X axis. |
Is Channel Calibration Applied on Y axis? |
A description of whether or not channel calibration has been applied to the Y axis. |
This token will display the X- and Y- coordinates for a selected vertex of a Quadrant.
The options are Center, Top, Right, Bottom, Left.
