Legend Options
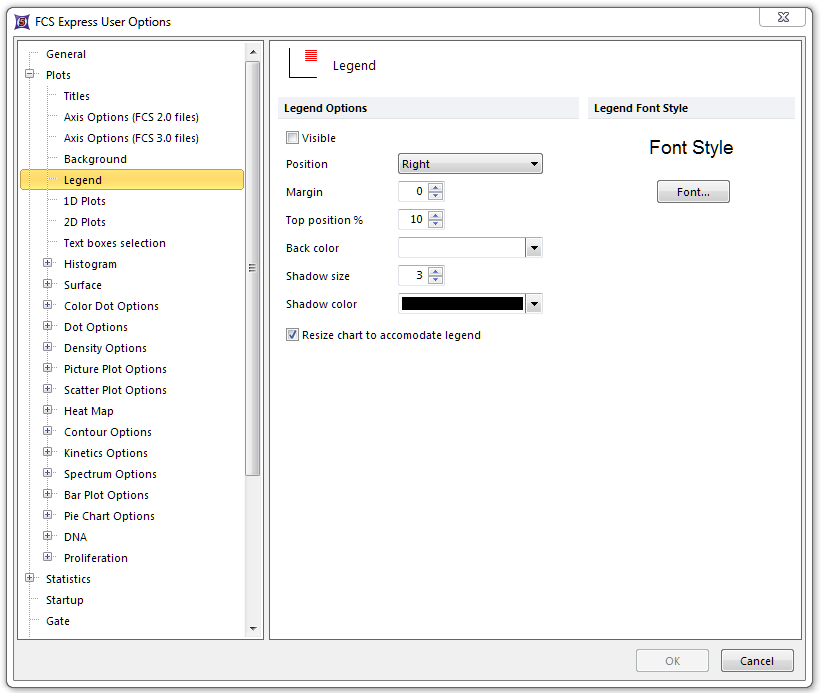
This category controls the default behavior and appearance of plot legends. The options are explained below and pictured in Figure 8.8.

Figure 8.7 Legend Options
Option |
Explanation |
|---|---|
Legend Options |
If Visible is checked, the legend will appear by default. If unchecked, it must be added via Formatting options on a per-plot basis. Position: This defines the position of the legend within the plot. Options are Left, Right, Top, Bottom. Margin: This defines how much space is available between the legend and the plotted data. Top Position: This defines the distance of the legend from the top of the plot. Back Color: This defines that color that is applied to the background of the legend. Shadow Size: This defines the degree to which a shadow is applied to a legend. A larger number applies a more intense shadow. A value of zero applies no shadow. Shadow Color: This defines the color of the shadow. Resize chart to accommodate legend: This defines whether or not the plotted area will resize itself to accommodate the size of the legend. |
Legend Font Style |
Defines the default font of legend text. |
