Magnifying a Plot
It is possible to Magnify a region of a histogram or 2D plot.
Magnifying Axes is equivalent to setting the minimum and maximum axis range for the plot. Magnifying Resolution also resets the range of data displayed on the plot, but also applies your Plot Resolution to the displayed range, rather than to the entire .fcs file.
To magnify a histogram:
| • | Right-click on the histogram and select either Magnify (Resolution) or Magnify (Axis) from the pop-up menu. |
| • | Press and hold the mouse button down where you want the lower bound of the magnification to be. |
| • | Drag the cursor to where you want the upper bound of the magnification to be. |
| • | Release the mouse button. |
An example histogram for the Magnification operation is shown in Figure 8.59.
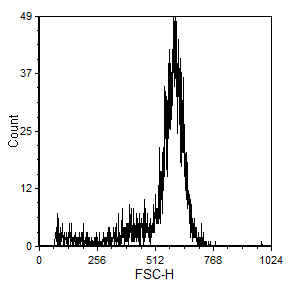
Figure 8.56 An Example Histogram Before Magnification
The result for Magnify (Resolution) for the region from channel 445.8 to 776.8 is shown in Figure 8.60.
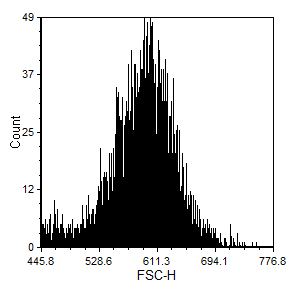
Figure 8.57 Magnify Resolution from Channel 445.8 to 776.8
The result for Magnify (Axis) for the region from channel 445.8 to 776.8 is shown in Figure 8.61.
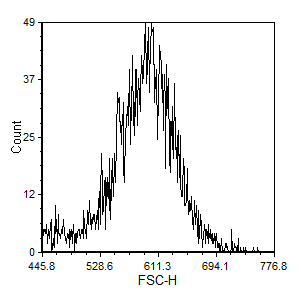
Figure 8.58 Magnify Axis from Channel 445.8 to 776.8
To release the magnification, right-click on the histogram and select UnMagnify (Resolution) or UnMagnify (Axis) from the pop-up menu.
Magnifying a 2D plot sets the minimum and maximum values on both the X- and Y-axis scales.
To magnify a 2D plot:
| • | Right-click on the 2D plot and select either Magnify (Resolution) or Magnify (Axis) from the pop-up menu. |
| • | Press and hold the mouse button down where you want one end of the magnification "box" to be. |
| • | Drag the cursor to where you want the other end of the magnification "box" to be. |
| • | Release the mouse button. |
An example 2D plot for the Magnification operation is shown in Figure 8.62.
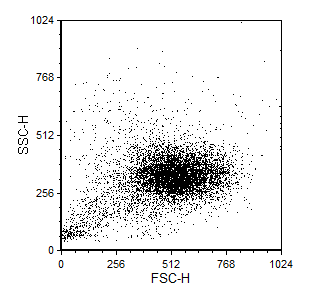
Figure 8.59 An Example 2D Plot Before Magnification
The result for Magnify (Resolution) for the region with the majority of cells is shown in Figure 8.63.
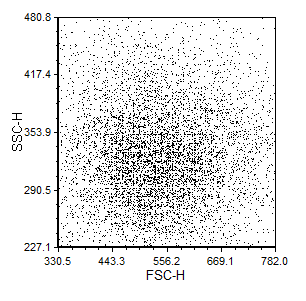
Figure 8.60 Magnify Resolution for a 2D Plot
The result for Magnify (Axis) for the region with the majority of cells is shown in Figure 8.64.
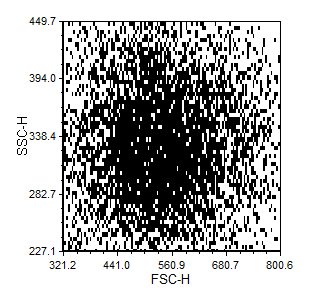
Figure 8.61 Magnify Axis for a 2D Plot
To release the magnification, right-click on the 2D plot and select UnMagnify (Resolution) or UnMagnify (Axis) from the pop-up menu.
