Principal Component Analysis
Principal Component Analysis (PCA) is a statistical procedure that uses an orthogonal transformation to convert a set of observations, in this case cytometry based events, into new variables called principal components. The transformation is defined in such a way that the first two principal components generally define the maximum variance while each succeeding component maximizes the variance at a 90 degree rotation. Principal components defined and applied to a plot in FCS Express are accessible for analysis as new parameters on plots.
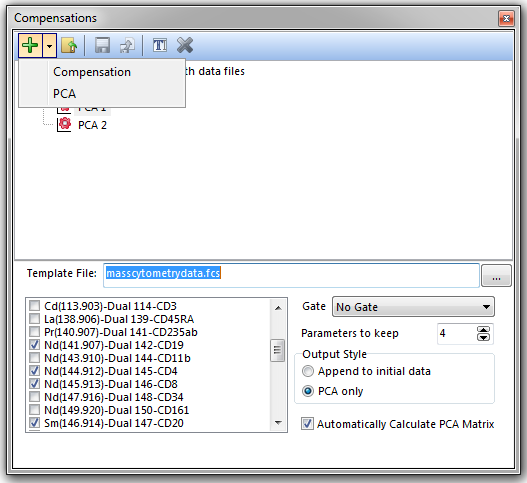
Principal Component Analysis is performed in FCS Express 5 through the Compensations window by clicking on the dropdown arrow adjacent to the green plus ![]() button (Figure 16.21). Once a PCA is defined and applied to a plot, standard gating and statistics may be used to evaluate the new principal component parameters.
button (Figure 16.21). Once a PCA is defined and applied to a plot, standard gating and statistics may be used to evaluate the new principal component parameters.
To begin working with PCA analysis in FCS Express please see the topics on:

Figure 16.21 Principal Component Analysis accessed through the Compensations window
