Populating Scatter Plots from Custom Data Grids
Scatter Plots are populated from Custom Data Grids.
If a Custom Data Grid exists on the layout, an inserted Scatter Plot will be automatically populated with the Custom Data within the Grid.
If more than one Data Grid exists, select the Data Grid that which is intended as the data source prior to inserting the Scatter Plot.
By default, the Scatter Plot will plot the first two columns of the Custom Data Grid for the X- and Y-parameters, respectively.
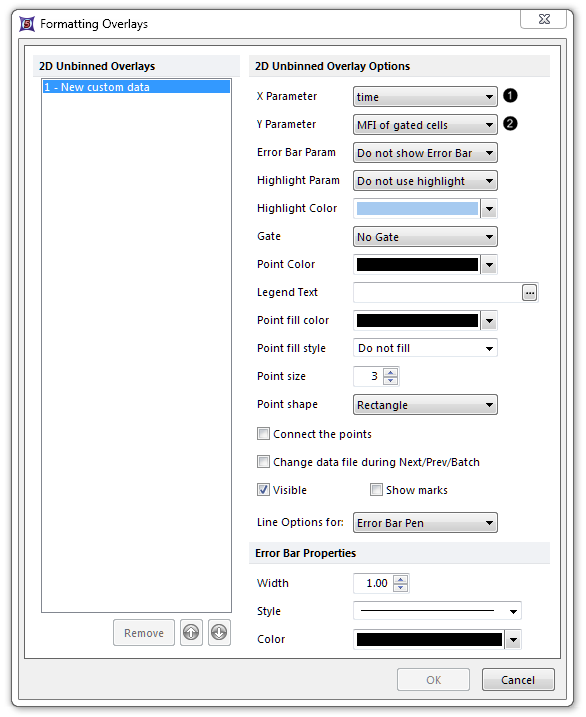
To populate the Scatter Plot with parameters other than the first two columns of the Custom Data Grid,

Fig. 11.42 Populating a Scatter Plot from Custom Data parameters
| 2. | Choose the Custom Data Parameter (i.e., Custom Data Grid column) intended for the X-axis, from the X Parameter drop-down menu ( |
| 3. | Choose the Custom Data Parameter (i.e., Custom Data Grid column) intended for the Y-axis, from the Y Parameter drop-down menu ( |
Note: Alternatively, click and hold on the axis parameter name and select the intended parameter from the list of available parameters.
To add an overlay to an existing Scatter Plot, either
| • | Drag and drop a Custom Data Grid onto the Scatter Plot. |
| • | Drag and drop another Scatter Plot onto the recipient Scatter Plot. |
| • | Right-click on the Scatter Plot. |
| 1. | Select Add Overlay from the pop-up menu. |
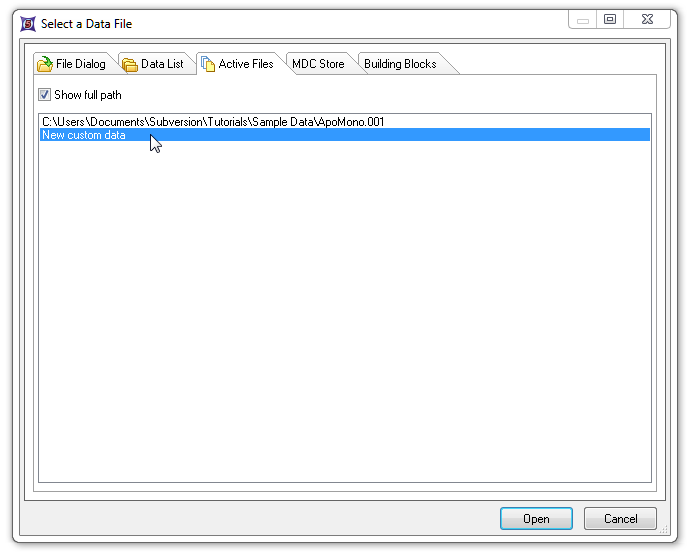
| 2. | Navigate to the data source in the Active Files tab of the Select a Data File Dialog (Figure 11.45). |
| 3. | Click Open. |
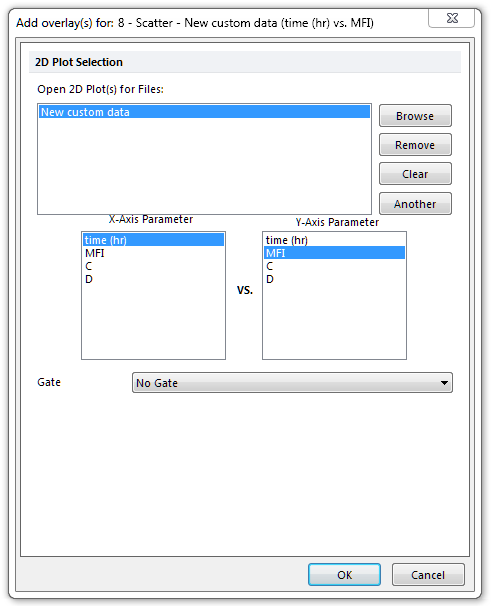
| 4. | Select the parameters for the new Overlay in the Add overlays dialog. |
| 5. | Click OK (Figure 11.46). |

Figure 11.43 Selecting Custom Data to overlay onto an existing Scatter Plot

Figure 11.44 Selecting parameters to overlay onto an existing Scatter Plot
