Batch Processing and Reporting for Image Data
In this section, we will learn how to:
•Open a layout and configure a batch process for several wells in a 96-well plate
•Configure the Batch Processing Actions to export the batch results as reports
•Pause between wells to confirm the current iteration of the batch is being analyzed correctly
•Reconfigure the batch to run in an automated fashion
•Export a high resolution image from the layout for publication purposes
•Export the layout to a PowerPoint
•Export the layout to .PDF
We will be using the IntroToImage4.fey layout for this section which is located in the Tutorial Sample Data archive→Intro to Imaging Tutorial folder. This layout contains a detailed pre-formatted approach to batch processing and report generation with image data.
For this section of the tutorial we will use data generated on the Molecular Devices ImageXpress Velos system (previously called "IsoCyte"). We will first open FCS Express 6 to check our preferences and then close and open the IntroToImage4.fey layout to learn how to import and load data into a data list.
The ImageXpress Velos System is a high-speed cytometer that conducts whole well imaging for an entire plate. Cells are typically 10-20 pixels each and appear as small dots within a whole well image. This system can scan plates in as little as 3 minutes enabling high throughput image-based cytometry. It is ideal for cytometric analysis of adherent cells that are difficult to study in suspension with Flow Cytometers.
The ImageXpress Velos data is fully compatible with FCS Express 6 Image Cytometry. As we will show in this tutorial, preferences can be set to immediately import and open data from the ImageXpress Velos into FCS Express. You will see images and plots from an Live-Dead experiment run on a 96-well plate. We will review one row of data from the plate for this experiment using a pre-configured layout for the tutorial. This single row includes wells treated with a dose response dilution series that result in all live to all dead. Live cells are stained with a dye identified in the software as "IMEAN-1" and dead cells with another dye identified as "IMEAN-3".
Section 1: Checking Preference Settings and Preparing a Batch Analysis
1. Start FCS Express 6.
2. Select Default in the user selection menu and click OK (Figure T28.51).
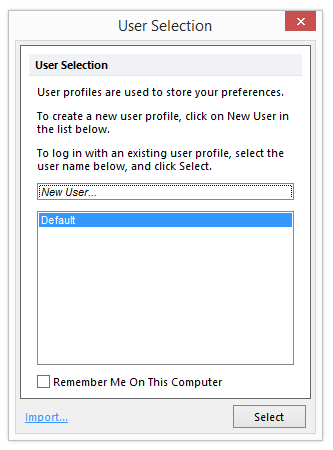
Figure T28.51 Selecting the Default User
3. Select New Layout from the Startup screen (Figure T28.52).
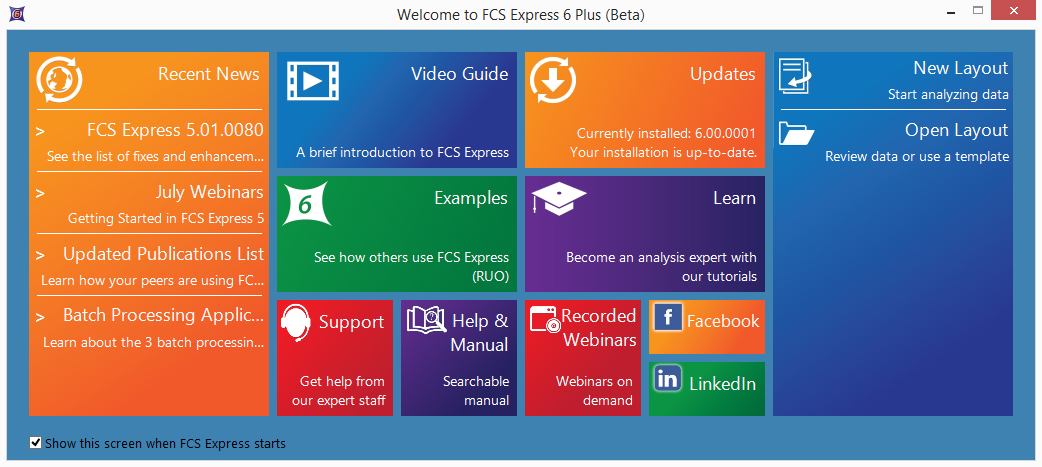
Figure T28.52 The Startup screen of FCS Express V6.
FCS Express 6 will open with a single blank page and the Home tab of the ribbon bar selected. We will now confirm that the data loading preferences are set correctly.
4. Click on the File tab→Options .

Figure T28.53 The FCS Express User Options button in the File tab.
5. Select the Data Loading→ImageXpress Velos options category (Figure T28.54).
6. Make sure that "Load images" is the only box with a check in it. It is only necessary to load data as a plate when working with the High Content module. Do not load data as a plate when planning to run a batch analysis, unless you are planning on batching through plates, and do not set to load background images unless you need them.
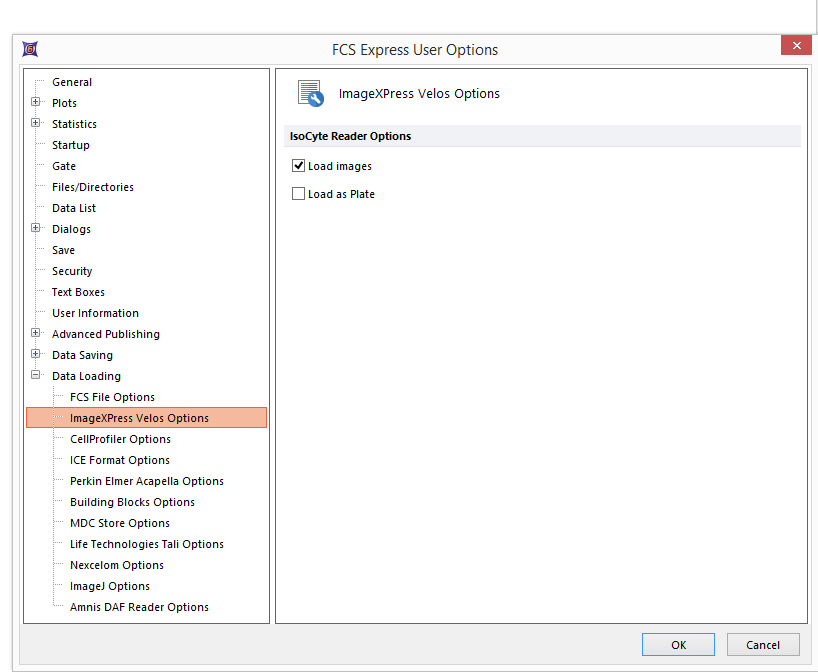
Figure T28.54 Correct Settings for Data Loading
8. Click OK.
9. Select File Tab→Open (Figure T3.1).
10. Load the IntroToImage4.fey layout from the Tutorial Sample Data archive→Intro to Imaging Tutorial folder.
You will see a pre-formatted template open for analysis and reporting of Data from Live-Dead Assays run on the IsoCyte / Image Express Velos. The Batch Setup page of the layout will have an empty Data List, an array of 4 unpopulated plots, with an empty summary data table at the top and a Gate View.(Figure T28.55). We will now import the data from the Tutorial Sample Data archive.
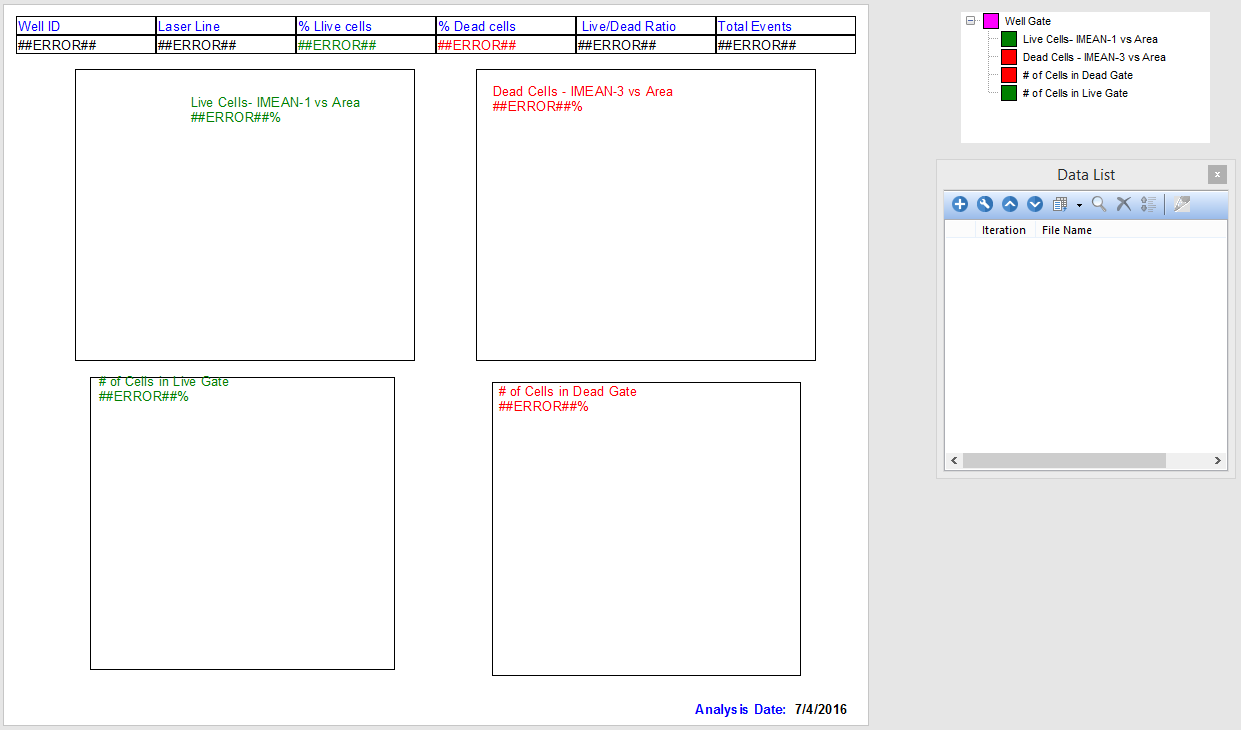
Figure T28.55 The Empty Layout Template
10. Click the ![]() button of the empty Data List to add data to the template (Figure T28.56).
button of the empty Data List to add data to the template (Figure T28.56).
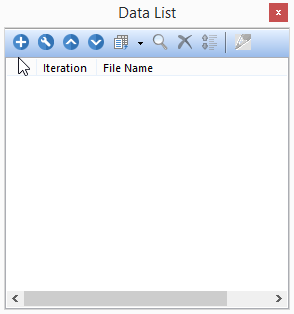
Figure T28.56 Empty Data List
11.Choose ImageXpress Velos files (*.iso) from the files of type: drop-down list in the Select a Data File dialog (Figure T28.57).
12. Navigate to the Sample Data→ImageXpress Velos With Images→Live_dead_96.well.iso folder (Figure T28.57).
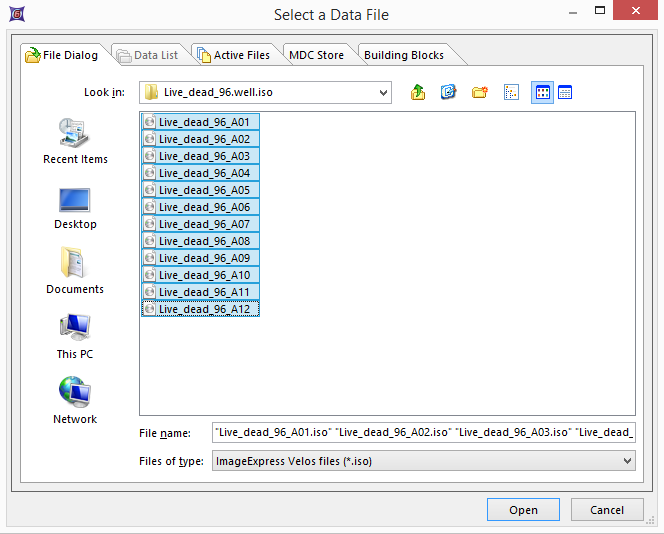
Figure T28.57 Selecting the Data Files to Import
13.Select all the Live_dead_96... files
14. Click Open.
The Data List will now populate with data from the 12 wells (A01-A12) of the Live-Dead Dataset (Figure T28.58).
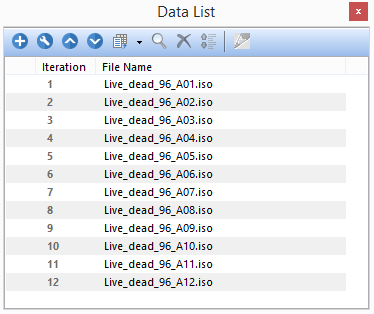
Figure T28.58 Data List showing Data Files
14. Click to select the first live-dead file (it will highlight in dark blue) (Figure T28.59 below).
15. Be sure that no objects are selected in the layout (click on any empty area to be sure of this)
16. Click on the Change data icon in the Data List menu and select Change Data On All Plots (Figure T28.59).
Note: the Change data icon would behaves differently if one or more object are selected in the layout.
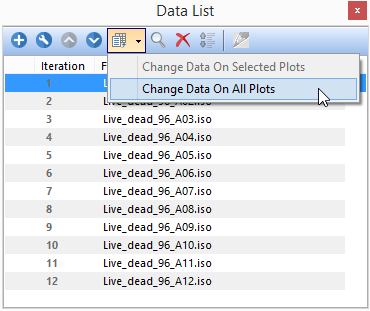
Figure T28.59 Selecting the Data File to Load Into Layout
All plots and tables in the layout page will populate with data from well A01 (Figure T28.60).
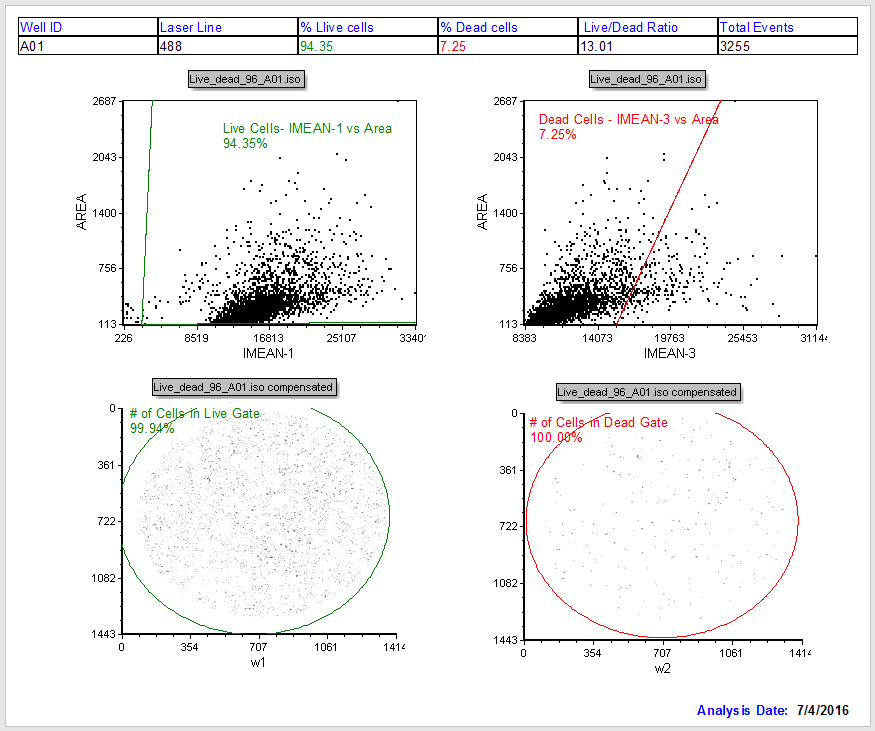
Figure T28.60 Batch Setup Page of IntroToImage4.fey Showing Data from Well A01
Let's review the entire Batch Setup page of IntroToImage4.fey again. Notice the page is configured with a summary table at the top and four plots (Figure T28.60). Two dot plots on the top indicate the Live and Dead cell channels, respectively for the given well. The picture plots on the bottom of the page are the live and dead images respectively. Live Cells and Dead Cells gates have been set in advance. Tokens on the dot plots calculate the percentage of live and dead cells. Additional gates (# Cells in Live/Dead) count total number of events in each of the fluorescent channels.
Observe in the data table at the top of the page that we are viewing data from well A-01 as noted in the top left cell in the table (Figure T28.61).

Figure T28.61 The Data Summary Table
Now we will go through our data list sample by sample
17. Click on the Data tab in the ribbon (Figure T28.62).

Figure T28.62 The Data List Tab
18. Click on the Change Data on All Objects→Next blue arrow to move to subsequent wells (Figure T28.61). Notice that all of the four plots update to show data and images from well A-02.
19. Step through the data for each of the wells using the Next blue arrow in the Change Data on All Objects menu. Observe the picture plots and dot plots updating and changing from mostly live cells to predominantly dead cells as you move through the series of wells. Observe that the data in the summary table also updates for each well.
20. Return to well A-01 by pressing the Previous blue arrow in the Change Data on All Objects menu repeatedly.
Now we will learn how to close and reopen the Data List window.
21. Observe the Data list in the layout (Figure T28.58).
22. Close the Data List by clicking the "x" in the upper right hand corner of the data list window.
23. Reopen the Data List by clicking the Data Tab→Organize Data Set→Data List icon on the ribbon (Figure T28.63).

FIgure T28.63 The Data List button within the Data tab
Modifying the Summary Table
24. Click on the Insert tab→General→Text Box in the ribbon (Figure T28.66).
25. Insert a new text box by left clicking on anywhere on the layout.
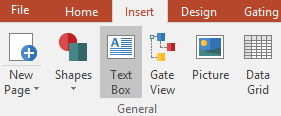
Figure T28.66 The Insert Tab
26. Right click on the text box to open the drop-down menu.
27. Select Table→Insert Table in the submenu that appears (Figure T28.67).
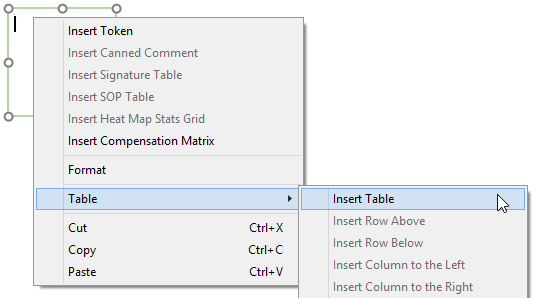
Figure T28.67 Inserting a Table
A new window will appear allowing you to create a table of any size and dimension (Figure T28.68).
28. Change the Number of columns: box to "5".
This demonstrates how the summary table already in the layout page was created. We will edit the pre-existing table in this tutorial instead of creating a new one. Click Cancel to avoid creating a new table.
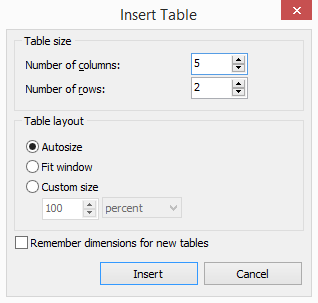
Figure T28.68 Insert Table Configuration
29. Delete the text box, by selecting it with a left mouse click and then right click and select Cut Text Box. Alternatively you can select the text box and use the delete key.
30. Click on the "Well ID" text in the cell in the upper left hand corner of the summary table (Figure T28.69).

Figure T28.69 Summary Data Table
31. Edit the "Well ID" text as you would in Word, Excel or PowerPoint.
32. Undo your edits with as many Cmd+Z commands as required to restore the "Well ID" text.
33. Select the A01 text in the lower left hand box of the summary data table using standard Windows selection techniques (click and hold the mouse to the right of the A01 text and drag the mouse over the entire text. Release the mouse when the text is selected). The grey background of the A01 text denotes that it is a Token. Notice the text turns white when selected (Figure T28.70).

Figure T28.70 Selecting the Token
33. Double click on the A01 Token. A formatting window will appear (Figure T28.71).
34. Select the Keyword category to choose a token displaying a Keyword from the data set (Figure T28.72).
35. Click on the ellipsis (...).
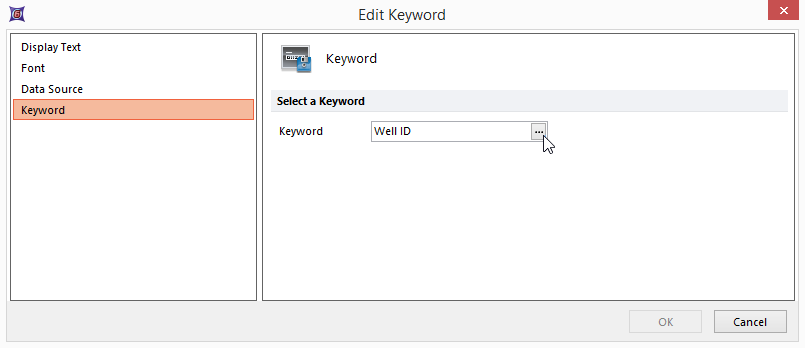
Figure T28.71 Edit Token Dialog Box
36. The list of the available keywords appears (Figure T28.72).
37. Select Well ID from the Please select a keyword dialog.
38. Click OK. You have just confirmed the Well ID as keyword to be printed in the Well ID column of our Summary table.
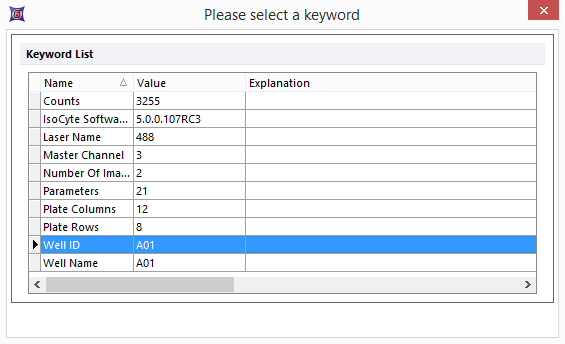
Figure T28.72 Selecting a Token To Display Well Name in the Summary Data Table
Optional: You may repeat 31-37 and go back to edit the "Laser Line" text heading in the summary data table with "Master Channel" and choose Master Channel for the Token to display. This will give you more experience with inserting a Keyword Token. Please undo your changes if you do this optional exercise.
In this report layout all of the values in the lower row of the Summary Data Table are Tokens which have been placed in the cells to insert dynamic data into the table. We have inserted the keywords for Well Name and Laser Name from the ImageXpress Velos data into the first 2 cells.
Note that we are able to label the summary data table titles any way we choose because they are simply text. They indicate "Well ID" and "Laser Line" for added clarity in the report from the default names (Well Name and Laser Name) reported by the instrument. The other values in the table are tokens that indicate calculated values from specific gates.
For example, the % Live cells and % Dead cells values are Tokens displaying the percentage of cells residing in the respective Live Cells or Dead Cells gates. The Live/Dead Ratio Token is a "custom token" in which we have used the custom token tools in FCS Express 4 to create a ratio of two existing values (% live / % dead) that are derived from the gates. We will not discuss Custom Tokens in detail here. For a complete tutorial on using Tokens please see "Text Boxes and Tokens" or review the "Using Tokens" section of the manual. We will not make any additional changes to Tokens used in the table.
38. Select all of the text in the Summary Data Table by clicking and dragging over the entire table. Alternatively, click in any cell of the table and use Cmd+A to select all text in the table (Figure T28.73).

Figure T28.73 Selecting all Text in the Summary Data Table
39. Select the Text tab as shown in Figure T28.74.
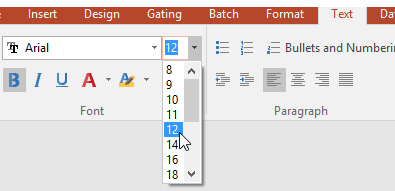
Figure T28.74 Text Tab Font and Bold Selection
40. Change the size of the font in the Table from 10pt to 12pt as shown in Figure T28.74 above.
41. Click on the "B" (bold) button to change all to Bold as shown in Figure T28.74 above.
Notice you have similar options for editing text in a layout page as you would expect in any Microsoft product. This allows layouts to be customized in any way you require for custom reporting. The Summary Data Table will now appear as in Figure T28.75a and Figure T28.75b below.

Figure T28.75a Summary Data Table All Cells Selected
42. Click anywhere on the summary data table to remove the highlighting for the selection and view changes (Figure T28.75b).
Figure T28.75b Summary Data Table All Cells Modifed to Bold and 12pt Font
Section 2: Configuring a Batch Analysis for Image Data
We will now configure a batch analysis and run through it to create a report to export from FCS Express 6. In this example the settings for the batch are pre-configured and we will review them, and then run the batch several ways. Please see the tutorial on Batch Processing for detailed instructions on configuring the advanced batch and reporting functions.
43. Click on the Batch tab→Batch Processing→Batch Actions (Figure T28.76).

Figure T28.76 Opening the Batch Actions Window
44. The Batch Actions window will appear as shown in Figure T28.77.
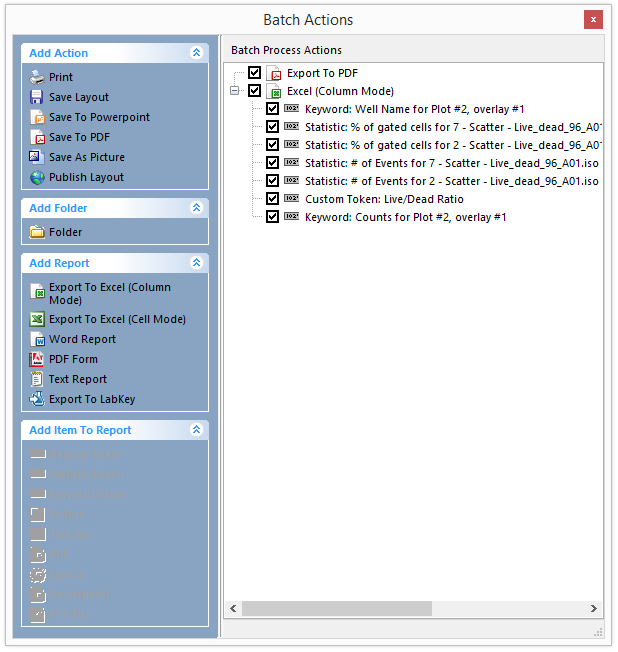
Figure T28.77 Batch Analysis Options and Configuration for IntroToImage4.fey
Notice in the Batch Actions menu that there are many options for setting up a batch analysis and report (Figure T28.77). Please review the items for familiarity, but we will not cover building from scratch in this tutorial. Once configured, batch analysis of data and report generation occur simultaneously and can be exported to Excel, PowerPoint or PDF files. For addition information on building reports refer to the Batch Processing tutorial.
Observe in the Batch Process Actions window that it is pre-configured to run batch analysis for each well in the Data List, and export information to both a PDF and an Excel spreadsheet. The PDF will show what we see in the Batch Setup Page, and the Excel file has been configured to log specific values to the spreadsheet automatically during the batch run. Items to be exported to Excel are listed.
To demonstrate the ease of configuring batch output, we will add one additional variable to the output for the Excel spreadsheet using drag and drop capabilities for tokens.
44. Select the token for Total Events in the summary data table on the Batch Setup page of the layout. Recall from that the Token will appear in white when selected properly (Figure T28.78).

Figure T28.78 Selecting the Token for Total Events
45. Click on the highlighted token; while holding the left mouse button down, drag it onto the Excel (Column Mode) icon in the Batch Process Actions window. When you see a "+" sign appear, release the left mouse button. As shown below in Figure T28.79.
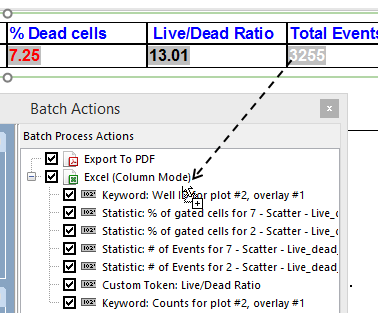
Figure T28.79 Drag and Drop Onto the Batch Actions List
46. Note that a new action has appeared in the Batch Process Action section (Figure T28.80).
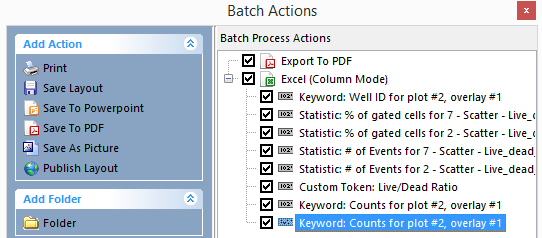
FIgure T28.80 The just added Batch Action is blue highlight
Please note that the action Keyword: Counts for Plot #2, overlay #1 is repeated twice since the exact same action was already present in the list.
In order to avoid replicate let's remove the first Keyword: Counts for Plot #2, overlay #1 action (the one NOT selected in Figure T28.80) by left clicking on it and pressing DEL on your keyboard.
Now we will modify the action just added in step 45-46.
47. Double click on the last item in the list, Keyword: Counts for Plot #2, overlay #1. A new window will appear.
48. Select the Field category on the left (Figure T28.81).
47. The Column Name Edit box will be empty and we will edit it by entering "Total Events" (Figure T28.81).
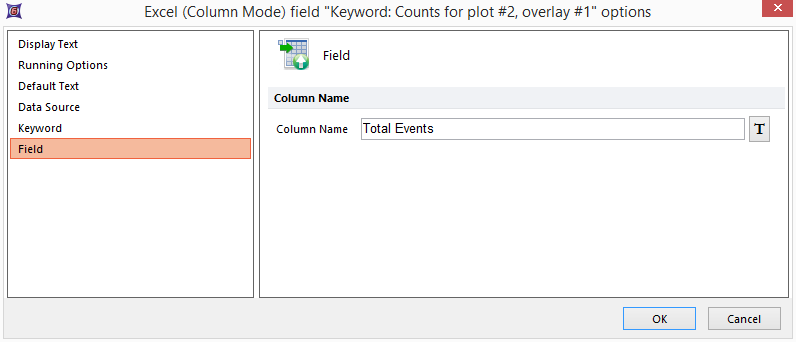
Figure T28.81 Editing the Column Name Box
49. Click "OK". You have now given the column name for the Excel file to log the Total Counts.
This Token has now been added to the excel export report. For each well the actual values will be logged into an Excel table, and we have edited the column header that will appear as "Total Events" in the report. You may turn off any Batch Action unchecking the checkbox next to it Batch Process Actions window list. We will not discuss configuring batch analysis in more detail in this overview tutorial. For a more detailed tutorial on Batch Processing please see the tutorial titled Batch Processing. There is also a detailed section in the Manual on Batch Processing.
We will now configure the paths to save our PDF and Excel reports to the desktop when the batch process runs.
50. Double Click on Export to PDF in the Batch Actions window (Figure T28.82).
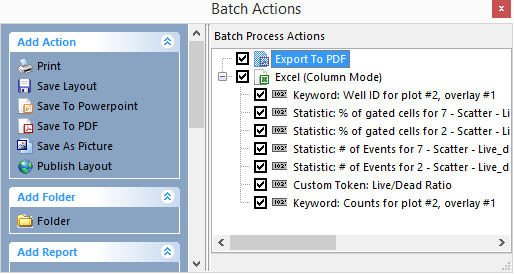
Figure T28.82 Editing the PDF Export Settings
A menu will open with Output file configuration options (Figure T28.83 below).
51. In the Output file options section click the Folder icon to select the saving location. A file dialog will open.
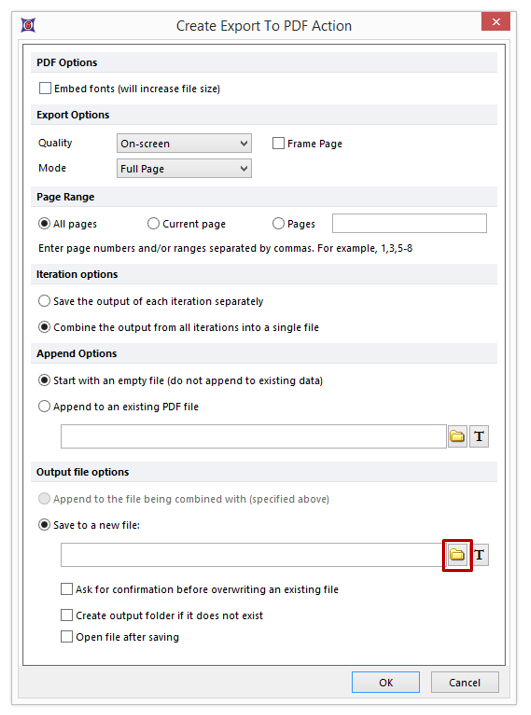
Figure T28.83 Editing the PDF Export Saving Path
52. Select your desktop and name your PDF "MyBatchReport".
53. Click Save and the path will appear in the empty Output file options window.
54. Click OK.
55. Double click on Excel (Column Mode) in the Batch Actions window (Figure T28.84).
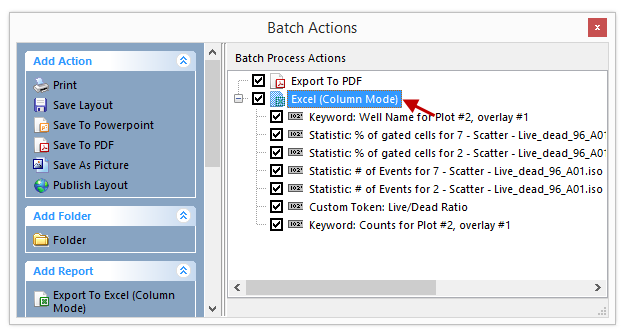
Figure T28.84 Editing the Excel Export Settings
A menu will open with Output file configuration options (Figure T28.85) below.
56. Just as you did for the PDF report, set the path to the your desktop and name your Excel file "MyBatchReport". (See Figure T28.85).
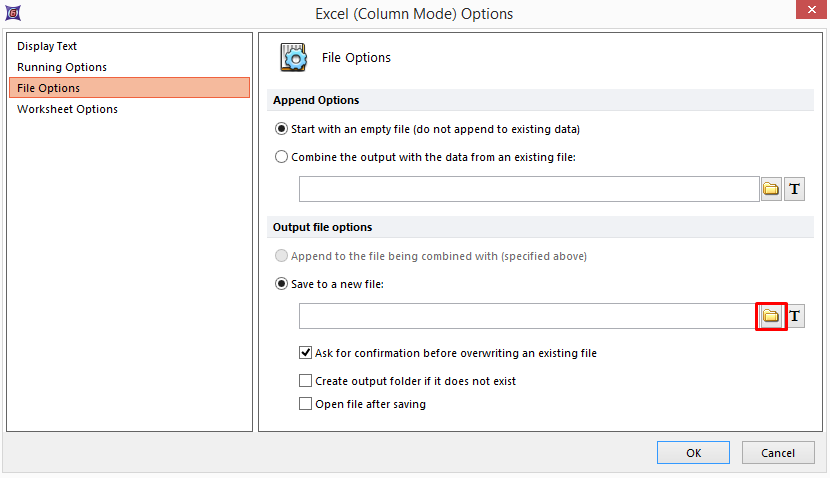
Figure T28.85 Editing the Excel Export Saving Path
Section 3: Running the Batch and Reviewing Reports
57. Click on the Batch tab→Batch Processing→Options. A configuration window will appear (Figure T28.86).
Notice that you have many options when configuring a batch process. Do not change any of the settings already configured. However, notice that we have selected the check box to Unconditionally pause between iterations. This way we do not need to run all wells to test a batch run. In this case we have only 12 wells and will allow the batch to run completely. Pausing between iterations is a great way to test a batch run through several steps without committing to a complete run. For a comprehensive view of all the options please refer to the Batch Processing Options manual.
58. Uncheck the box for Unconditionally pause between iterations.
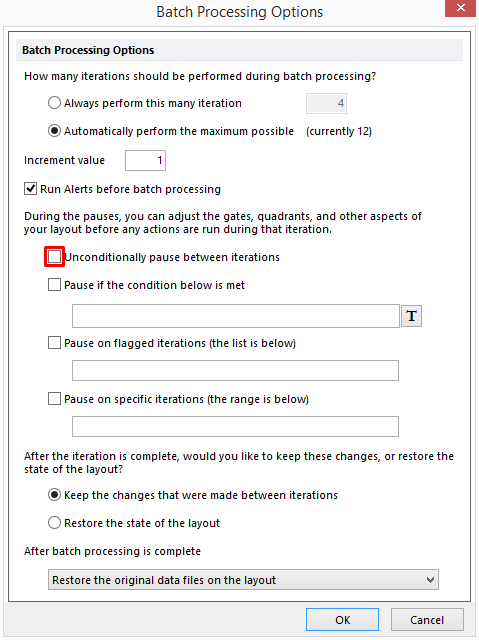
Figure T28.86 Configuring Batch Processing Options
59. Click OK.
60. Click on Batch tab→Batch Processing→Run.
The batch process will run for roughly less than one minute. A status window will appear during the batch process showing how far the batch has progressed (Figure T28.87).
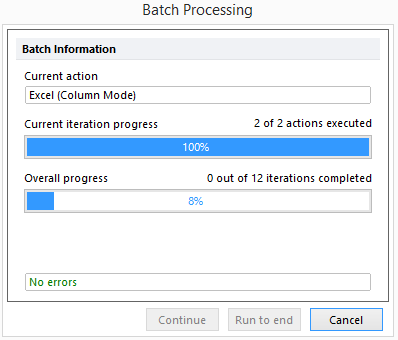
Figure T28.87 Batch Processing Status Window
When finished A PDF file called MyBatchReport.pdf will open automatically with the report. Similarly, an Excel file called MyBatchReport.xls will open. (Figure T28.88).
61. Review the PDF document and confirm there are 12 pages of data, one for each well processed (Figure T28.88)
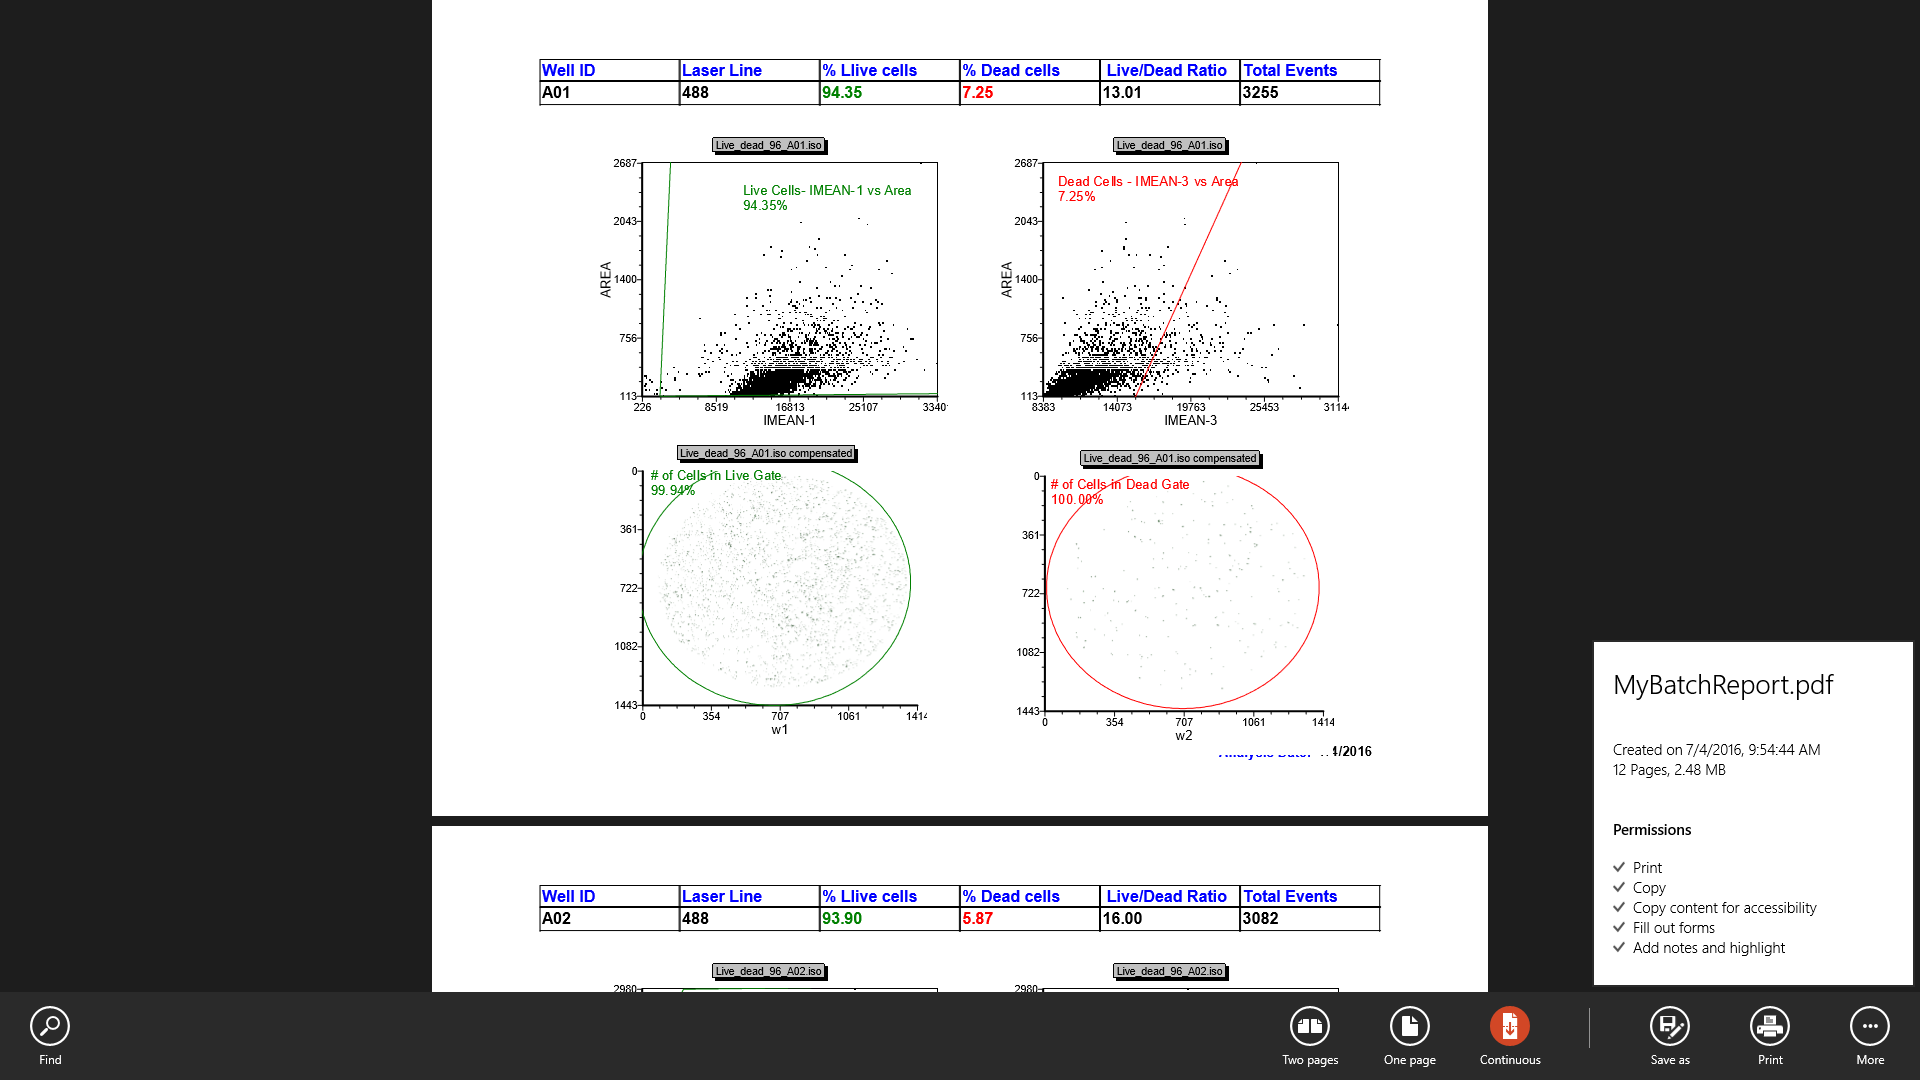
Figure T28.88 "MyBatchReport" PDF Report from Batch Actions
An Excel file will open (Figure T28.89). This Excel spreadsheet will have 12 rows of data set to export visible with the designated column labels. Notice that Total Events is now a column with the appropriate title.
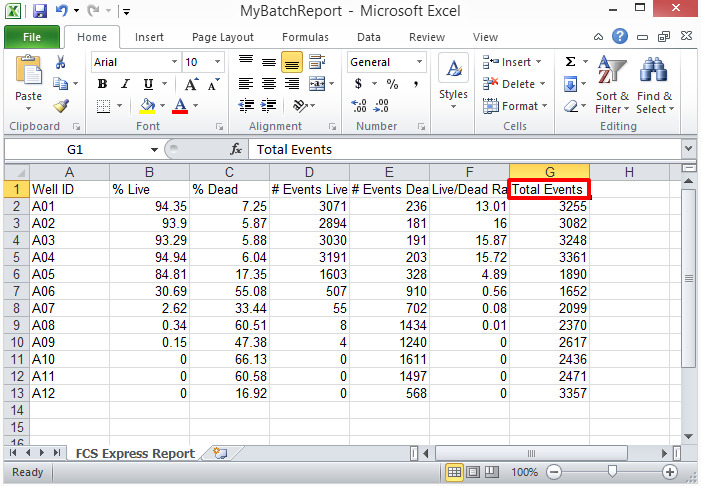
Figure T28.89 "MyBatchReport" Excel Spread Sheet Report from Batch Actions
62. Close the Batch Actions window and all PDF and Excel files. You do not need to save the reports.
Exporting a high resolution picture from FCS Express
You can also save out any selected components of a layout page as a high resolution graphic or publication figure.
63. Select the Live Cells Live_dead_96_A01.iso picture plot as shown in Figure T28.90.
Note, the picture plot will have a green border of you select by clicking on the center body of the plot. It will have a red border if you select by clicking on the edge of the plot or a green border. Either state of selection is fine for exporting an image.
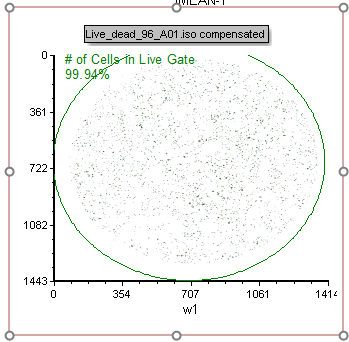
Figure T28.90 The Live_dead_96_A01.iso compensated" Picture plot
64. Click exactly on the border (no matter whether it is green or red) of the plot and select Save selection As Picture (Figure T28.91)
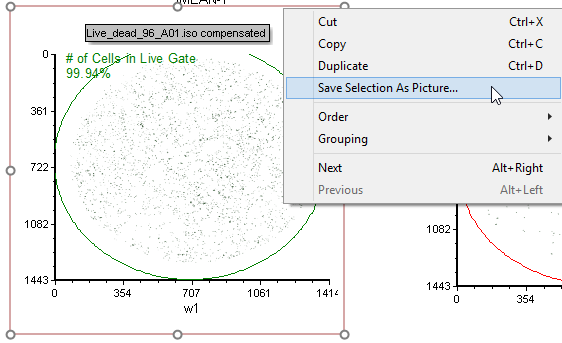
Figure T28.91 Saving a Selected Plot as a Picture
65. Select the Desktop as a destination and input "MyExportedImage" for the filename.
66. Select .TIF format to save the image in .tif format.
67. Click Save.
68. Review the .tiff image on your Desktop. Notice it is a high resolution image. You can change the precise resolution in the FCS Express preferences.
69. Close the Layout and do not save changes.
Congratulations! You have completed the Introduction to FCS Express 6 Image Cytometry Tutorial.
