Data Source Token Property
The Data Source token property is available only for Statistic and Keyword tokens. Many of these tokens are used to obtain information from an .fcs data file or from a plot on the layout. As the data changes in a layout, the token information will update as well.
Keyword tokens display .fcs file keyword information and Statistic tokens display statistics calculated from the data. Each .fcs file contains multiple keywords which can also be viewed from the View Header window.
The Data Source token property is used to define where a token gets its information. A token can obtain information directly from an .fcs file or from the data that is being displayed on a plot. If the data source is a plot, then the token will update whenever the data on that plot changes.
To configure a Data Source token property for a Statistic token using an .fcs data file:
2. Insert a Text Box on the page and type in "The number of events in my data file are: " (with a <space> after colon). Make sure that the flashing cursor is located after the <space>.
3. Right-click near the flashing cursor in the text box, and select Insert Token from the pop-up menu.
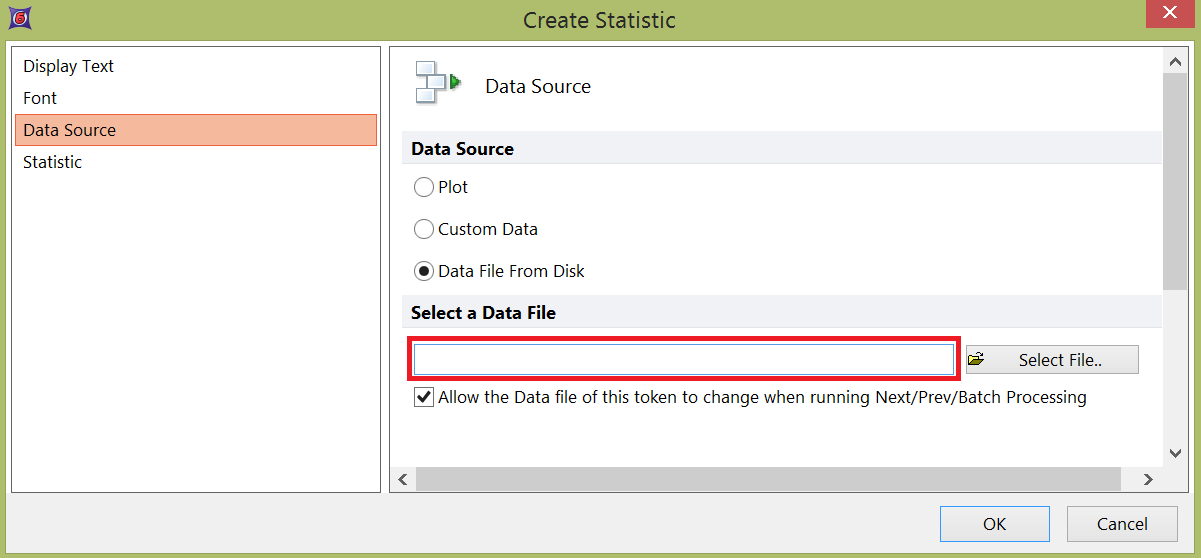
4. Choose the Statistic token and then click the Insert button. The Create Statistic dialog will appear. If there are no plots on the layout (as in this example), choose the Data File from Disk radio button (Figure 19.8).

Figure 19.8 Create Statistic Dialog - Data Source - Data File from Disk
5. Click on the Select Data File button to locate an .fcs file, which will cause the Select Data File dialog to appear if Standard Open Data Dialog is chosen under user options or Open Data File dialog to appear if Advanced Open Data Dialog is chosen under user options. When you have chosen an .fcs file, the filename will appear in the Select a Data File field (outlined in red in above figure.)
6. Leave the default option: Change data file during Next/Prev/Batch enabled, so that the token information will update when the Data Source changes.
Note: Instead of performing Steps 3 to 6, you can also drag a file from the Data List and drop it near the flashing cursor in the text box then directly select Statistics from the Paste Special dialog. By clicking OK you will be directly prompted with Step 7 below. You may still go to the Data Source section to change any options if you choose.
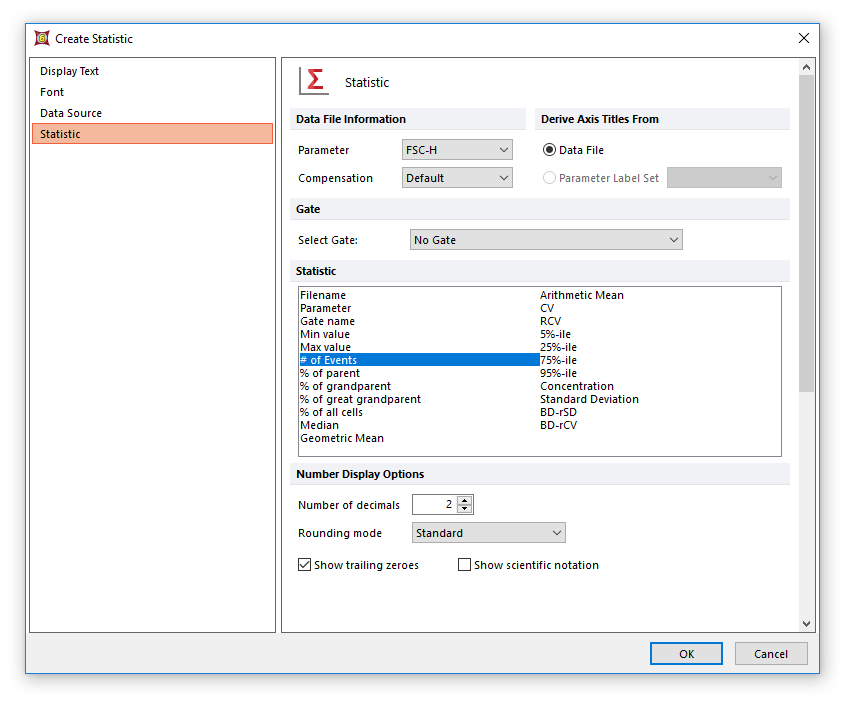
7. Click on Statistic from the list of token properties on the top-left of the Create Statistic dialog.
8. Select a Parameter from the drop down for the statistic.
9. Select a compensation or choose Default or None from the Compensation drop down.
Note: by setting Default from the Compensation drop down, the default option for compensation specified in the User Options will be used.
10. Choose a gate from the drop-down list if any gates exist on the plot. The default is No Gate which will use all events on the plot.
11.Select one, or multiple select, a Statistic option, such as # of Events (Figure 19.9).

Figure 19.9 Create Statistic Dialog - Statistic Page
9. Click OK. The text box will display the text entered in step 2 followed by the statistical data from step 7 for the .fcs file selected in step 5.
To configure a Data Source token property for a Statistic token using a plot:
1.Open an existing layout, or create a new one.
2.Insert a 2D Dot Plot on the page if there are none.
3.Insert a Text Box on the page.
4.Right-click on the text box, and select Insert Token from the pop-up menu.
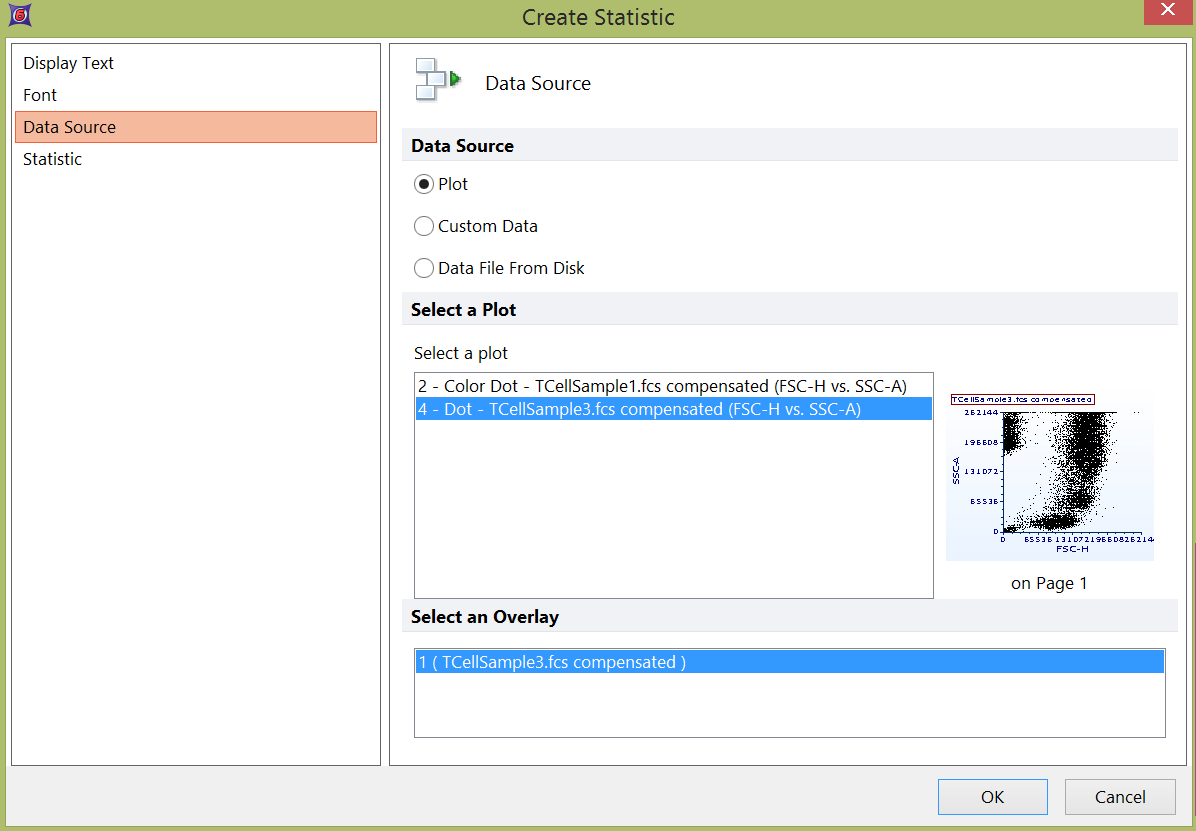
5.Select Statistic, and then click the Insert button. The Data Source page of the Create Statistic dialog will appear with Plot selected as the default Data Source type (Figure 19.10).

Figure 19.10 Create Statistic Dialog - Data Source Page
6.Select a plot from the Select a plot field, which lists the plots on the layout.
Note: If multiple overlays exist on the selected plot, the desired overlay must be selected from the Select an Overlay field appearing below the Select a plot field.
7.Click on the Statistic category on the left.
8.Select a Statistic from the Statistic list, such as # of Events.
9.Click OK.
The Create Statistic dialog closes, and you will see that the text box now displays the number of events in the plot.
Keyword tokens work in the same way as Statistics tokens, with the following exceptions:
•To insert a keyword token, select Keyword after selecting Insert Token in Step 4 above.
•In the Create Keyword dialog, there will be a Keyword category on the left side of the window. After you select that category, you will be able to type in a keyword, or select one from the list of default keywords (see Editing Keyword Tokens).
