Adding statistics to your layout
In this section, we will:
•Add a default statistics table to our layout.
•Fill a custom text-table with selected statistics.
•Define a custom ratio using a Custom Token.
It is easy to add default statistics tables as well as custom-made tables and statistics to your FCS Express Layout. We will now add one example of each to this Immunophenotyping Tutorial Layout.
1.Select File tab→Open.
2.Open the layout Immunophenotyping Tutorial Ready for Summary Statistics.fey found in the "Immunophenotyping Tutorial" folder within the Tutorial Sample Data archive.
The Layout has been saved linked to the .fcs files in the same folder, and should resemble your Layout after completing the previous section of the tutorial. You may use this Layout or your own Layout to proceed to Step 3.
3.Right-click on the contour plot in the lower-left corner of the Layout (Fig. T29.28; note: the plot pictured is from the provided layout for this section and shows red outlier dots added as in optional Steps 27-32 from Section 1. If you are using your own layout from the previous section and skipped those steps, your plot will look slightly different.)
4.Select Quadrant statistics from Statistics on the associated pop-up menu (Fig. T29.28).
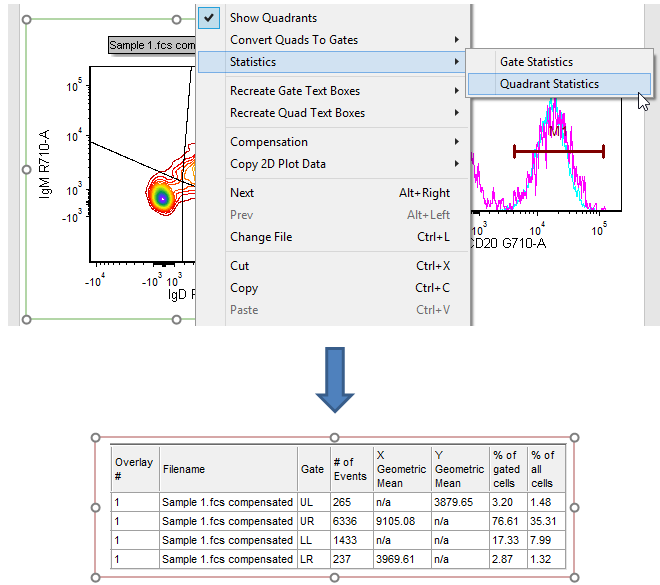
Figure T29.28 Adding a default quadrant statistics window to the layout
A quadrant statistics window appears, similar to Fig. T29.28. Note: you may move this statistics window to a convenient part of your layout, such as below the contour plot.
Note: Default statistics windows may also be similarly added for gates, markers, and histograms. You may right-click on the quadrant statistics window to add or remove various statistics.
A Default statistics window is a convenient way to quickly display summary statistics for a given plot. Summarizing the results of your entire experiment, however, often requires data from multiple plots on the layout. This is easily accomplished in FCS Express by adding statistical and keyword tokens to custom-made tables in a text box. We will now add statistical tokens to the text table in the lower-right corner of the layout, which was custom designed within a text box. The chief advantages of these custom tables are: statistics from disparate plots may be displayed; an endless variety of statistics including user-defined statistics may be defined; and, the appearance of the table itself is fully formattable.
5.Click on the border of the histogram to select it (Fig. T29.29)
| Note: the histogram pictured is from the provided layout for this section and shows a normalized histogram as formatted in optional Steps 59-62 from the previous section. If you are using your own layout from the previous section and skipped those steps, your histogram will instead resemble Fig. T29.23.) |
6.Drag the plot toward the upper-right cell in the table (Fig. T29.29, ![]() ).
).
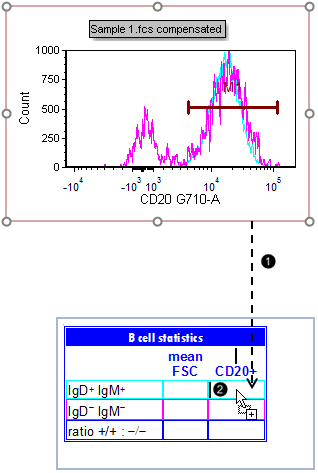
Figure T29.29 Dragging and dropping a marker-derived statistical token into a text table
7.Release the mouse when the cursor is visible within the upper-right, turquoise cell in the table (Fig. T29.29, ![]() ). Go on to Step 8 or to Step 11 if you were referred here from a more advanced point in this tutorial.
). Go on to Step 8 or to Step 11 if you were referred here from a more advanced point in this tutorial.
8.Double-click Statistic token in the Paste Special dialog (T29.30, ![]() ).
).
9. Select "M1" in the Select a marker drop-down menu of the Edit Statistic dialog box that appears (Fig. T29.30, ![]() ).
).
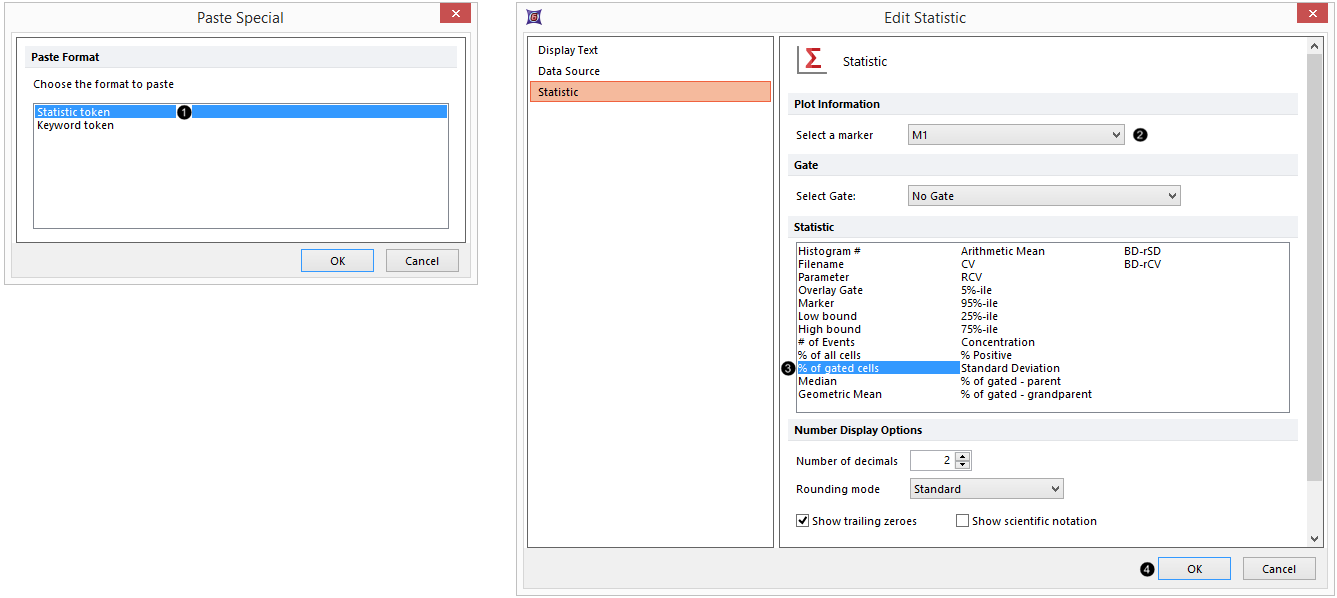
Figure T29.30 Selecting a marker-derived statistical token
10.Select % of gated cells in the Statistic list (Fig. T29.30, ![]() ).
).
11. Click OK (Fig. T29.30, ![]() ).
).
12. Repeat Steps 5-9, but drag the marker into the pink cell reserved for the double-negative, CD20-positive population (immediately below the cell indicated in Fig. T29.30).
13. Click on Data Source in the category at left (Fig. T29.31, ![]() ).
).
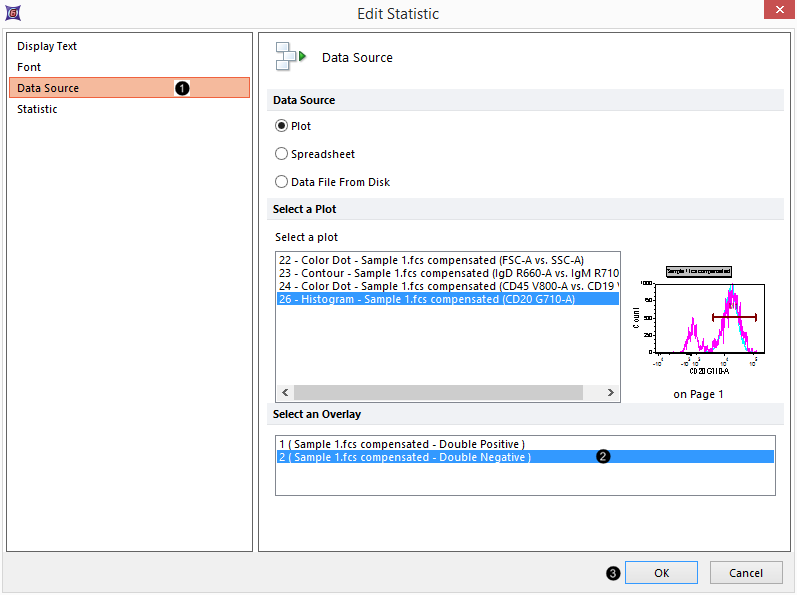
Figure T29.31 Defining the second overlay in the histogram as the data source for a statistical token
14. Click on the second overlay to select it as the Data Source for this statistic (Fig. T29.31, ![]() ).
).
15. Click Statistic and select % of gated cells.
16. Click OK (Fig. T29.31, ![]() ). The two tokens now appear in the text table as shown in Fig. T29.32. Note: exact values may vary in your layout due to your placement of gates, markers, and quadrants. You may adjust any of these and watch the tokens update accordingly.
). The two tokens now appear in the text table as shown in Fig. T29.32. Note: exact values may vary in your layout due to your placement of gates, markers, and quadrants. You may adjust any of these and watch the tokens update accordingly.
17. Press and hold the mouse button inside the boundaries of the red "scatter" gate in the upper-left color dot plot (Fig. T29.32).
18. Drag it toward the table (Fig. T29.32, ![]() ).
).
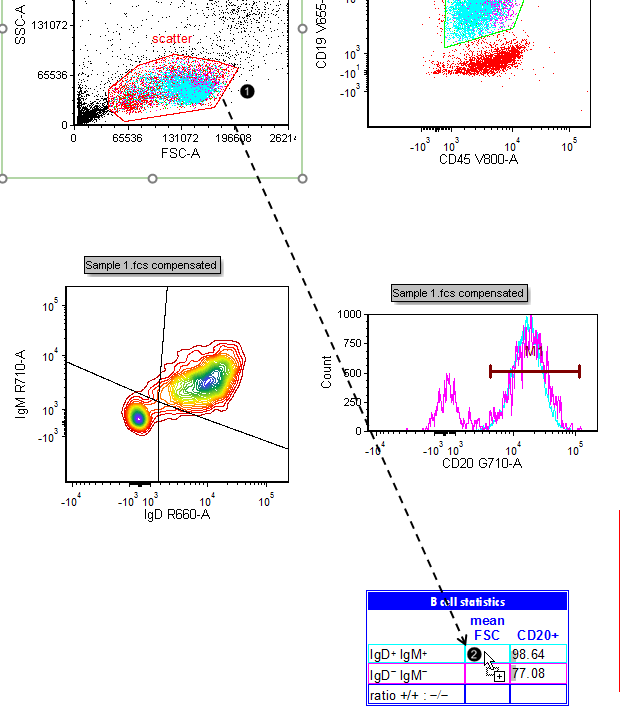
Figure T29.32 Dragging and dropping a gate-derived statistical token into a text table
19. Release the mouse when the cursor is visible inside the turquoise cell pictured in Fig. T29.32, ![]() .
.
20. Select "double positive" from the Gate drop-down menu of the Edit Statistic dialog box that appears (Fig. T29.33, ![]() ).
).
21. Select X Arithmetic Mean in the Statistic category (Fig. T29.33, ![]() ).
).
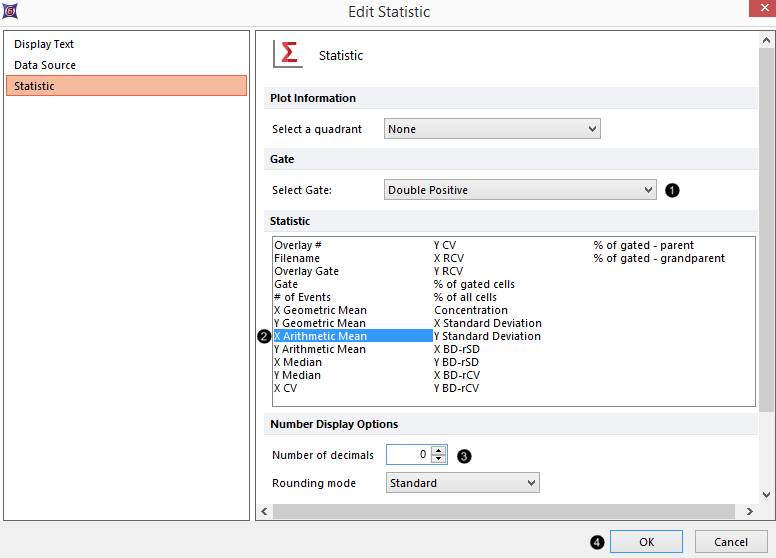
Figure T29.33 Selecting a gate-derived statistical token
22. Reduce the Number of decimals to "0" (Fig. T29.33, ![]() ).
).
23. Click OK (Fig. T29.33, ![]() ).
).
24. Repeat Steps 16-22, but drag the "scatter" gate into the pink cell reserved for the double-negative population (immediately below the cell indicated in Fig T29.32), and select "double negative" in the Gate drop-down menu.
We will now define a ratio between the CD20-positive populations of the IgD/IgM-double-positive and -double-negative B cells using Custom Tokens, which we will subsequently enter into the lower-right blue cell in the table reserved for "ratio +/+ : -/-".
25. Select the View tab →Tokens→Custom Tokens (Fig. T29.34).

Figure T29.34 Opening the Custom Tokens window
26. Move the floating Custom Tokens window to the side of the page so the plots are visible.
27. Click the blue Plus button (![]() ) for (Create a new Custom Token) (Fig. T29.35,
) for (Create a new Custom Token) (Fig. T29.35, ![]() ).
).

Figure T29.35 Defining a new custom token as a ratio between two regular statistical tokens
28. Type "CD20 ratio" as a descriptive name for the Custom Token (Fig. T29.35, ![]() ).
).
We will now define a Formula for a simple ratio, using a procedure similar to that used in Microsoft Excel↑. However, instead of typing static numbers into the Formula, we will enter the Tokens we defined in the text table on the layout. Thus, as the values of the tokens change among different samples in our experiment, the value of the "CD20 ratio" Custom Token will update accordingly.
29. Type an equals sign ("=") in the Enter the Custom Token formula below pane of the Custom Tokens window (Fig. T29.35, ![]() ).
).
30. Highlight the Token in the upper right, turquoise cell of the Layout (Fig. T29.35, ![]() ).
).
31. Drag it toward the Enter the Custom Token formula below pane, while keeping the mouse button pressed.
32. Release the mouse when the cursor appears after the equals sign ("=") (Fig. T29.35, ![]() ). The Token Description will appear there, highlighted in blue.
). The Token Description will appear there, highlighted in blue.
33. Type a division sign ("/") in the Enter the Custom Token formula below pane of the Custom Tokens window (Fig. T29.35, ![]() ).
).
34. Repeat Steps 29-31 for the Token in the pink cell corresponding to the CD20-positive, IgD/IgM double-negative population. The complete "CD20 ratio" Custom Token Formula is pictured in Fig. T29.35, extreme right.
We will now drag and drop this "CD20 ratio" Custom Token into the appropriate cell, to complete the "CD20+" column of the text table on our Layout.
35. Press and hold on the "CD20 ratio" Custom Token in the Custom Tokens Window (Fig. T29.36, ![]() ).
).
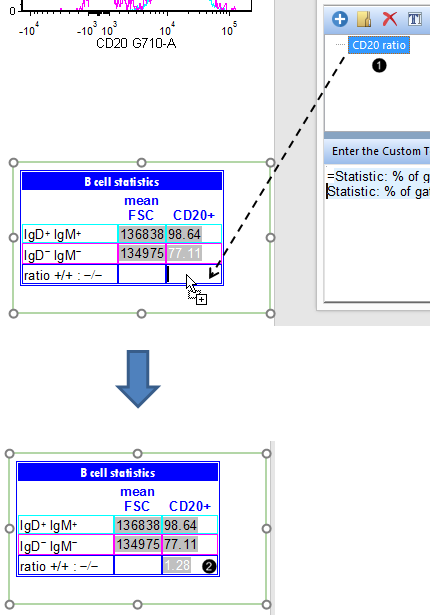
Figure T29.36 Dragging and dropping a custom token from the custom tokens window into the summary text table on the layout
36. Drag it toward the lower-right cell in the text table.
37. Release the mouse when the cursor is visible in the appropriate cell (Fig. T29.42, dashed arrowhead). The value of the "CD20 ratio" Custom Token will appear as in (Fig. T29.36, ![]() ). Note: the value may differ slightly from that shown, depending on your placement of gates, markers, and quadrants. You may adjust these to watch the value of the "CD20 ratio" Custom Token update in real-time.
). Note: the value may differ slightly from that shown, depending on your placement of gates, markers, and quadrants. You may adjust these to watch the value of the "CD20 ratio" Custom Token update in real-time.
You have now added a default statistics table to your layout, and have filled a custom text table with selected statistics, including a custom ratio between two statistics.
Learn even more about using text boxes and tokens to take advantage of the powerful statistical features in FCS Express by viewing a recorded webinar and completing a separate tutorial dedicated to this topic.
In the final section of this tutorial, we will batch process our data to generate Microsoft PowerPoint™ and Excel↑™ reports.
