Inserting a 2D Plot

Contents
To insert a 2D plot:
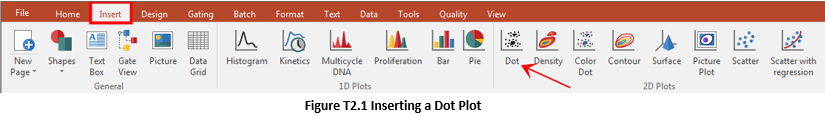
1.Select the Insert→2D Plots→Dot command (Figure T2.1).
2.Move the mouse to a place on the layout where you would like the top-left corner of the plot to be located.
3.Click the mouse on the page where you want the top-left corner of the plot to appear.
A Select a Data File dialog box will appear (Figure T2.2).
Notice that all the data files in the dialog box appear with an FCS file icon, even though their extension is not ".fcs". This is because FCS Express knows that many FCS files are not saved with a ".fcs" extension, and it performs special checking (and appropriately sets the icon to make sure you can easily recognize your FCS data files).
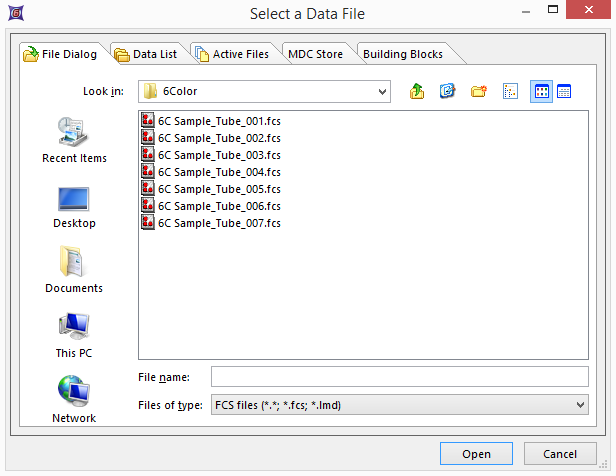
4.Select the GFPcontrol.001 data file from the FCS Express Sample Data directory (Figure T2.2).
5.Press the Open button.
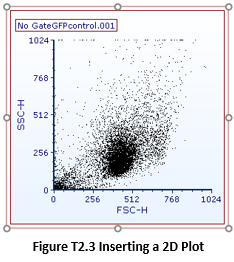
The newly inserted 2D dot plot will now appear in the layout with a default size (Figure T2.3). You can change the default size by placing the cursor over any of the red handles on the selected plot and adjusting as necessary. Refer to the tutorial on using objects for more information on resizing objects.
Next, we will insert a histogram.