Interpolating values from Scatter with Regression Plots
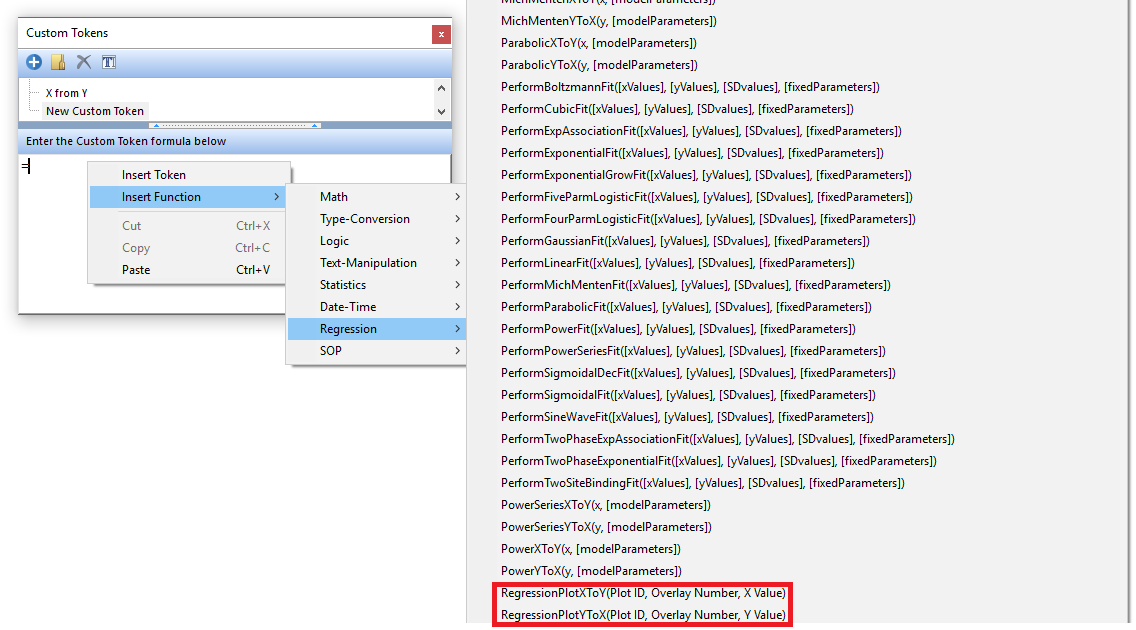
X- or Y-values can be interpolated from Scatter with Regression Plots using the "RegressionPlotYToX" and "RegressionPlotXtoY" functions, via the Custom Tokens window (Figure 11.69) or via a formula in the Spreadsheet. See below or this Use Case Tutorial section for details.

Fig. 11.69 Regression Plot Interpolation Custom Token Functions
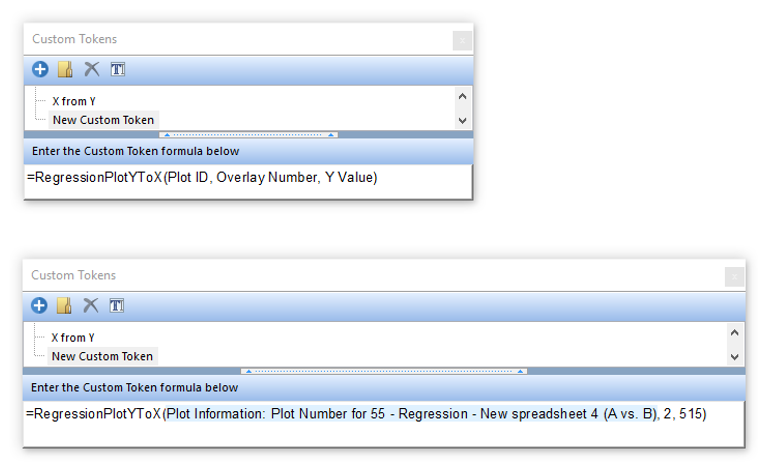
The components of the Custom Token are Plot ID (i.e., the Plot Number token), Overlay Number for the Regression Overlay (note: the overlays are 1-based, so the raw data is Overlay #1, and the first regression is Overlay #2), and the X- or Y-value from which the interpolated value will be derived. An example of an unfilled and filled Custom Token formula is shown below in Figure 11.70, top and bottom, respectively.

Fig. 11.70 Interpolation Custom Token formula components unfilled (top) and filled (bottom)
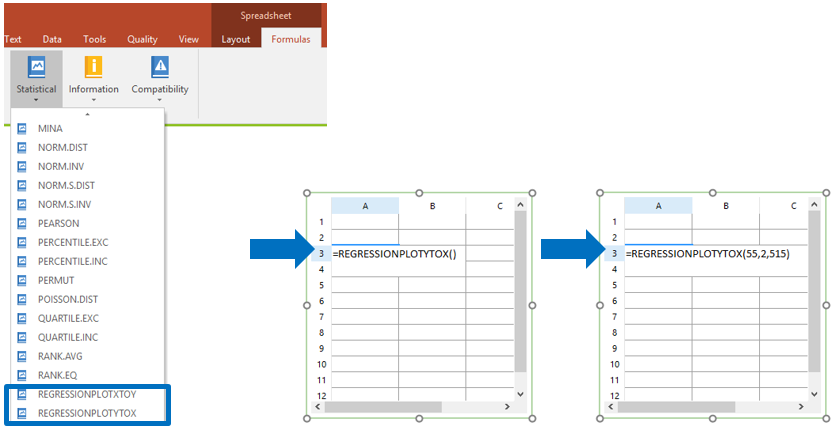
Interpolation formulas can also be entered into a Spreadsheet from the Spreadsheet tab→Formulas→Statistical group of functions, as shown in Figure 11.71.

Fig. 11.71 Regression Plot Interpolation Formula (left) inserted in Spreadsheet (center) and with components filled (right).
