Interpolating values from the regression
We will now interpolate the X-value for the Vmax calculated from the Scatter with Regression Plot in the previous section, using the "RegressionPlotYToX" Custom Token function.
Please ensure that the previous section of the tutorial has been completed before proceeding.
1.Select the View tab→Tokens→Custom Tokens command.
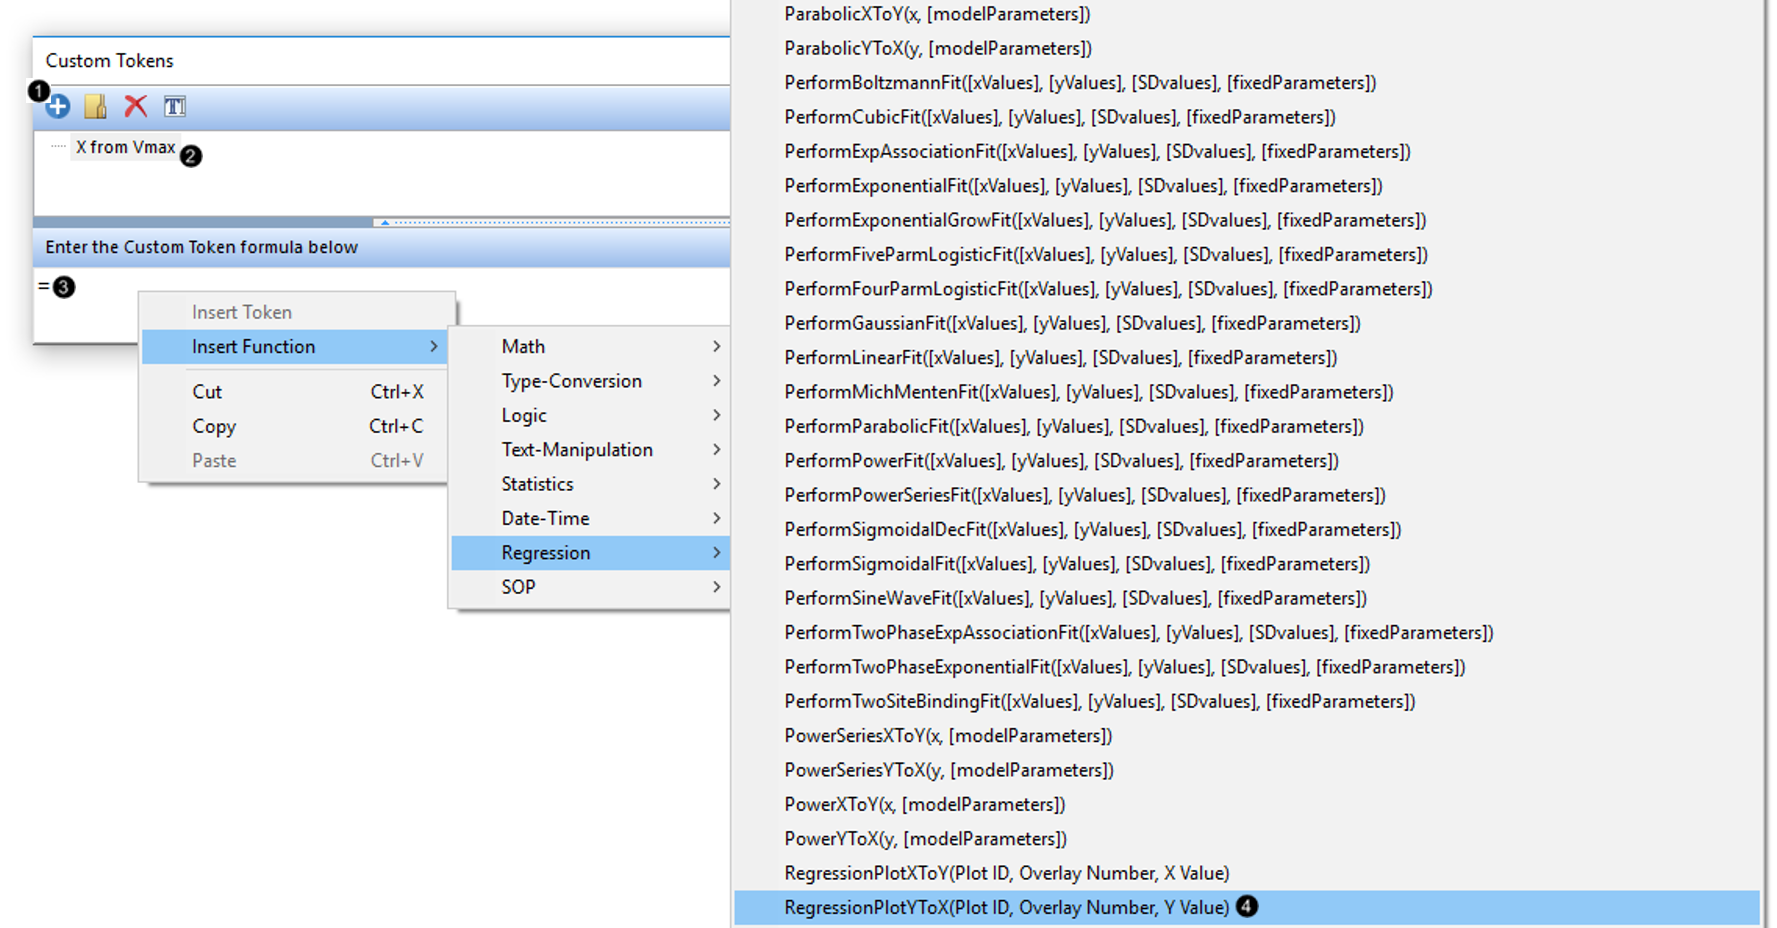
2.Click on the blue plus in the Custom Tokens window to Create a new Custom Token (Fig. T17.25, ![]() ).
).
3.Type "X from Vmax" to descriptively title the new Custom Token (Fig. T17.25, ![]() ).
).
4.Type an equals sign ("=") in the Custom Token formula pane of the Custom Tokens window (Fig. T17.25, ![]() ).
).
5.Right-click and select Insert Function> Regression > RegressionPlotYtoX from the pop-up menu (Fig. T17.25, ![]() ).
).

Figure T17.25. Inserting a Custom Token function to interpolate X from Y from the regression
The Custom Token formula pane now appears as in Fig. T17.26.

Figure T17.26. "RegressionPlotYtoX" Interpolation Custom Token formula
We will now replace the components of this Custom Token with specific information from our layout.
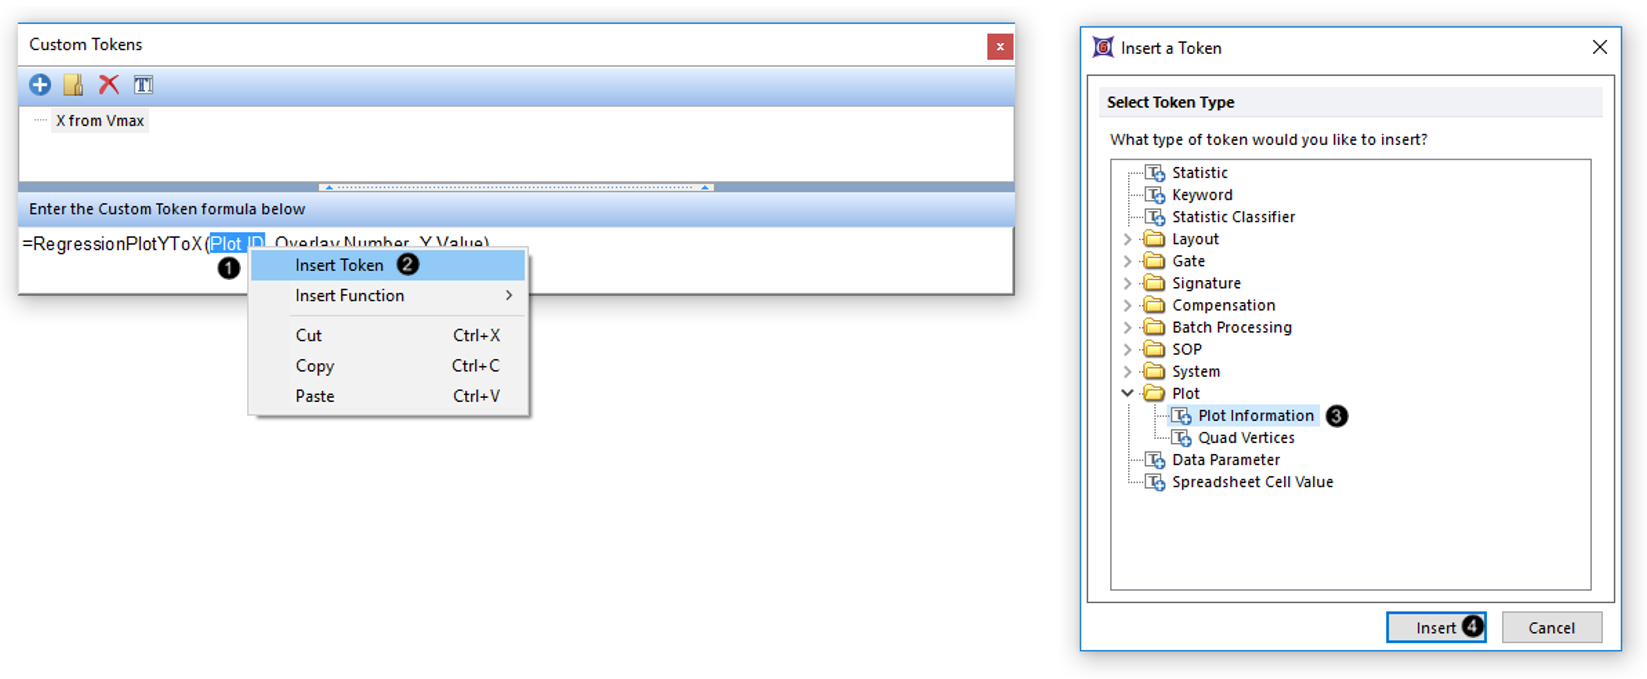
6.Highlight the "Plot ID" text of the Custom Token (Fig. T17.27, ![]() ).
).
7.Right-click on Plot ID and select Insert Token (Fig. T17.27, ![]() ).
).
8.Select Plot Information from the Plot node of the Insert a Token dialog (Fig. T17.27, ![]() ).
).
9.Click Insert (Fig. T17.27, ![]() ).
).

Figure T17.27. Filling components of the Custom Token
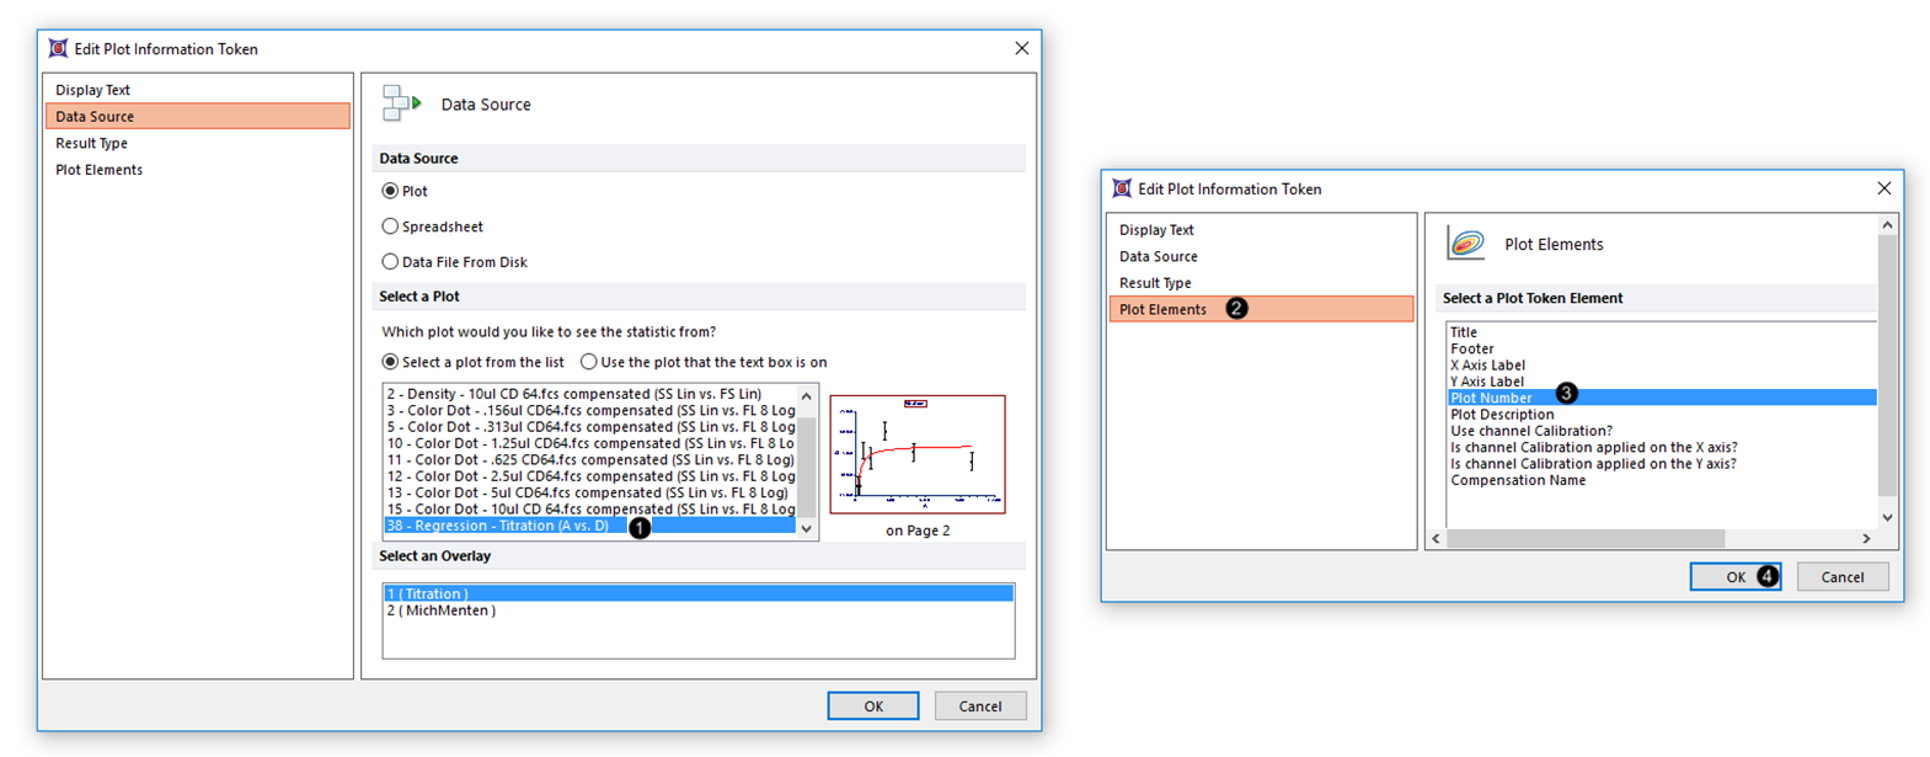
10.Scroll to and select the Regression plot under the Select a Plot box of the Edit Plot Information Token dialog window (Fig. T17.28, ![]() ). A thumbnail image at right aids in selection of the correct plot.
). A thumbnail image at right aids in selection of the correct plot.
11.Select the Plot Elements category at left (Fig. T17.28, ![]() ).
).
12.Select Plot Number from the Select a Plot Token Element box (Fig. T17.28, ![]() ).
).
13.Click OK (Fig. T17.28, ![]() ).
).

Figure T17.28. Filling components of the Custom Token, continued
14.Highlight the "Overlay Number" text of the Custom Token (Fig. T17.27, above).
15.Type "2", as the Regression line is the second overlay in the Scatter with Regression Plot.
16.Highlight the "Y value" text of the Custom Token (Fig. T17.27, above).
17.Type a value close to the Vmax, e.g., "500".
Note: typing in a value too close or equal to the Vmax will result in a non-useful, very high X-value, as the Michaelis-Menten equation asymptotically approaches the Vmax. As an alternative to typing in an arbitrary freetext value, you could create a Custom Token that is equal to a percentage (e.g., 90%) of the Vmax regression token, and enter this Custom Token in place of the "Y value" text.
The "X from Vmax" Custom Token formula now appears as below (Fig. T17.29, left). We will now insert the result as a Custom Token onto our layout.
18.Drag and drop the "X from Vmax" Custom Token from the upper pane of the Custom Tokens window to an empty spot on your layout, or to the Scatter with Regression plot.
The Custom Token's mathematically calculated value is now displayed in a Text Box (Fig. T17.29, center). We will now add descriptive freetext to the Text Box.
19.Click inside the Text Box so that it enters edit mode (its border appears green as in Fig. T17.29, right).
20.Type "The amount of antibody to use is" before the Custom Token, and "uL" or "microliters" for units after the Custom Token.
The interpolated X-value for the close-to-Vmax Y-value chosen in Step 17 is now displayed on the layout (Fig. T17.29, right).

Figure T17.29. Inserting the completed Custom Token for interpolated X value onto the layout
