
A Quadrant Set can be formatted by one of the following two methods:
1.In the Gate Navigator (Figure 7.47) or in the Gate View, either:
oDouble-click on the Quadrant Set (green arrow in the picture below) you wish to format, or
oRight-click on the Quadrants Set (green arrow in the picture below) you wish to format, and select Gate Properties from the right-click menu.

Figure 7.48 The Gate Navigator dispalying a Quadrant Set and its four Quadrant Gates.
The Edit Quadrants window will open (Figure 7.48).

Figure 7.49 Edit Quadrants window
Option |
Explanation |
|---|---|
Name |
The name for the set of quadrants, as displayed in the Gate View and Gate Navigator.
|
Comment |
Allows the user to annotate additional information |
Description |
A description for the set of quadrants. The parameters reported here are the original X and Y parameter (respectively) the quadrant was created on.
E.g. "9 vs. 7" means that the selected quadrant was created on a plot displaying parameter 9 on the X axis and parameter 7 on the Y axis.
|
Color |
The color of the quadrant lines, when displayed on a 2D plot, in the Gate Navigator and Gate View.
|
Line width |
The width of the quadrant lines, when displayed on a 2D plot.
|
Always create a Data Specific Gate when moving this gate |
If this box is checked, when the quadrants are moved, the quadrants will become data-specific gates.
|
Linked quadrants |
This section of the dialog lists linked quad sets, if any. In the screenshot above, this section reports "<No Gate Links>", since there are no quad sets linked to the currently selected quad set.
|
Centerpoint |
When editing a set of quadrants in this Edit Quadrants window, the coordinates reported here are centerpoint of the Master Quadrant Set (i.e. if the selected Quadrant Set has been made Data Specific for one or more files, any customization made to the centerpoint through this window, will only apply to the Master Quadrant Set). A token may be used as the coordinate value along a given parameter by clicking T. The individual parameter numbers and names associated with that quadrant are provided.
Note: Quadrants are associated with two parameters, not with the X and Y axes of the plot. If a set of quadrants is associated with FL1 and FL2, the FL1 coordinate will define the position of the quadrant centerpoint on that parameter, regardless of whether it is displayed on the X or Y axis. Like gates, quadrants remember parameters according to what is reported in the Layout Options setting (See "Parameters remembered by", i.e. by "name" or by "number").
|
Locked If this box is checked, the centerpoint cannot be manually moved on the 2D plot along the corresponding axis.
|
|
Floating (allow angles other than 90 degrees) If this box is checked, when quadrants are added to a plot, they will be the floating type.
When editing a set of quadrants in this Edit Quadrants window, the angles shown in this section refer to the angles of the Master Quadrant Set (i.e. if the selected Quadrant Set has been made Data Specific for one or more files, any customization made to the Angles through this window, will only apply to the Master Quadrant Set).
|
|
Upper, Lower, Left and Right If the quadrants are the Floating type, this value (in degrees) indicates the angle of the corresponding quadrant line with respect to the x-axis. A custom value can be entered in each of the four fields.
|
|
If this value is True then quadrants can be moved/resized. If this value is False, the quadrants cannot be moved/resized. Using the Custom option a formula can be written for conditionally determining if a quadrant can or cannot be moved/resized.
|
2.Through the Selected Gate or Quadrants Properties category of the 2D plot's formatting menu, shown in Figure 7.49.
This dialog can be accessed by first clicking on the centerpoint of the quadrant of interest to select it, and then by one of the following methods:
•Select the 2D plot(s) and use the Format→2D Options→Selected Gate or Quads command.
•Right-click on the 2D plot, select Format from the pop-up menu, and choose Selected Gate or Quadrants Properties from the drop-down menu at the top of the formatting dialog.
The Selected Gate or Quadrants Properties dialog will be shown.

Figure 7.50 Selected Gate or Quadrants Properties category of the plot's format dialog
The Selected Gate or Quadrants Properties formatting dialog contains the same options than the Edit Quadrant dialog (please see table above), plus a few additional options:
Explanation |
|
|---|---|
Selected Gate or Quadrants |
See the Edit Quadrants dialog above
|
Properties |
See the Edit Quadrants dialog above
|
A list of quadrant sets that are currently linked to the selected quadrant set.
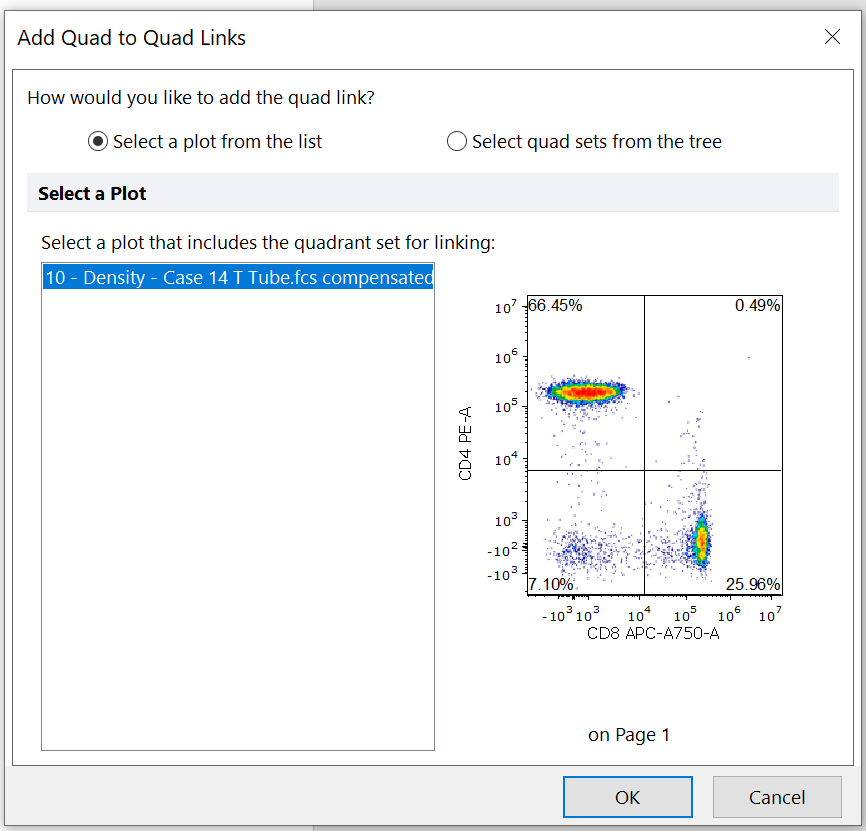
The Link button allows selection of a quadrant set in another plot to link to the selected plot. In the Add Quad to Quad Link dialog, select the quadrant set by selecting a plot where the quadrant set is located or from the hierarchy tree.
The Unlink button will break the link between two quadrant sets that have already been created with the selected quadrants.
See more details in the Linking Quadrants to Quadrants chapter.
|
|
Centerpoint |
The X and Y coordinates for the centerpoint of the selected Quadrant Set. Note that if the selected Quadrant Set is a Data Specific Gate, changes made to the Centerpoint coordinates in this window will only apply to the Data Specific Gate, not to the Master gate.
Note: "X" and "Y" will not match the X and Y parameters of the selected plot in case axes on the latter have been flipped. The "X" and "Y" coordinates of the centerpoint refer to the orignal X and Y parameters the quadrant has been created on. Said original parameters are the ones reported in the Description field (see above).
A token may be used as the coordinate value by clicking the T button at the right of the centerpoint of interest.
Two shortcut buttons allow you to Convert Tokens into Value and Set Centerpoint as Percentile (please see below in this table).
|
Locked If this box is checked, the centerpoint cannot be manually moved on the 2D plot along the corresponding axis.
|
|
Convert Tokens into Value If the X or Y centerpoint is currently set as a token, clicking this button will remove the token and assign a numeric value to both the X and Y centerpoints.
|
|
Set Centerpoint As Percentile This option allows the user to set the X and/or Y coordinates of the centerpoint to any percentile so that the centerpoint automatically updates as the data on the plot changes.
Please refer to the "Description" field above for a definition of X and Y coordinates.
For instance, if you set a coordinate to the 99th percentile, that coordinate of the centerpoint will automatically update so the centerpoint is set at the channel where 99% of the events are below it. It can be useful to set Percentile Quadrants on your controls and then on plots displaying your sample, link the quadrant centerpoint to a plot displaying the control. To disable percentile-based centerpoints, click Convert Tokens into Value. To manually move the centerpoint afterward, uncheck Locked for the X and Y centerpoints.
See more details about setting centerpoints as percentiles.
|
|
Angles |
Floating (allow angles other than 90 degrees) If this box is checked, the selected Quadrant Set will be of floating type. Note that if the selected Quadrant Set is a Data Specific Gate, changes made to Angles in this window will only apply to the Data Specific Gate, not to the Master gate.
|
Upper, Lower, Left and Right If the quadrants are the Floating type, this value (in degrees) indicates the angle of the corresponding quadrant line with respect to the x-axis. A custom value can be entered in each of the four fields.
|
|
Linked Quad Gates |
The Create button opens a Create Gate dialog window. This allows users to create a new gate that is linked to a Quadrant Gate of the Quad Set and determine where in the Gate Hierarchy this new gate should appear by selecting a Parent Gate from a drop-down menu (the Parent Gate selected by default is the gate applied to the base overlay of the plot). The Edit button allows a user to edit a gate linked to quadrants. The Delete button allows a user to delete a gate linked to quadrants.
See more details in the Linking Gates to Quadrants chapter.
|
Allow Gate Move/Resize |
See the Edit Quadrants dialog above
|
Setting centerpoints as percentiles
To set the quadrants to the percentile type, the centerpoint along the X and/or Y axis should be set to a percentile.
•In the format dialog of a 2D plot containing quadrants, navigate to the Selected Gate or Quadrants Properties category.
•Under the Centerpoint section, click Set Centerpoint as Percentile (shown in Figure 7.50).

Figure 7.51 Customizing the Quadrant Centerpoint
• The Set Quads as Percentile window opens (shown in Figure 7.51)

Figure 7.52 Set Quads as Percentile window
•By default, the radial button Keep current value is selected for both parameters. If it is selected, no change will be made to the centerpoint along the corresponding parameter.
•To set the centerpoint to a percentile on the X or Y axis, select the radial button for the parameter of interest called Percentile of selected plot's axis, enter the desired percentile, and select the axis for that percentile to be based on.
▪In the figure above, to set the centerpoint along the FL1-H parameter to always be placed so that 70 percent of events on the plot have X-axis values less than the centerpoint, a value of 70 has been entered.
▪In the same figure above, to set the centerpoint along the FL3-H parameter to always be placed so that 25 percent of events on the plot have a Y-axis value less than the centerpoint, a value of 25 has been entered.
▪The quadrants will appear as on the plot below (Figure 7.52). In this case, 70 percent of events on the plot are located to the left of the centerpoint and 30 percent of events are located to the right of the centerpoint. 25 percent of events are located below the centerpoint and 75 percent of events are located above the centerpoint.

Figure 7.53 Percentile Quadrants on a 2D Density Plot
•When the centerpoint is set to a percentile, a token appears in place of the centerpoint value (shown below in Figure 7.53). The token indicates the percentile (e.g. 70%-ile). The associated centerpoint is set to Locked.

Figure 7.54 Tokens Inserted to Set Centerpoint to Percentile Values and Locked
•To convert the token(s) to a value and disable the percentile setting, click Convert Tokens into Value.
•To manually move the centerpoint afterward, uncheck the Locked checkbox(es).
Adding Linked Quad Gates
See more details in the Linking Gates to Quadrants chapter.