Export to Spreadsheet
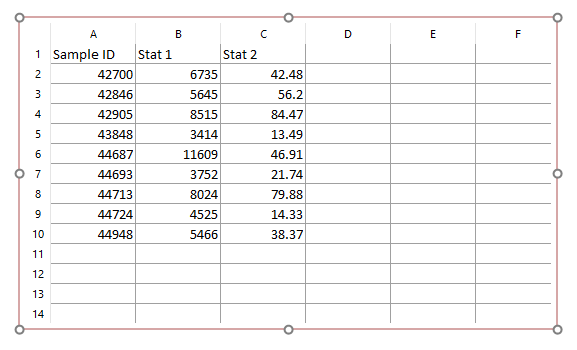
All tokens added to this report will be written to the integrated Spreadsheet selected in the File Options (see below). Each token will be reported in its own column. By default, the values for each iteration are written in the same column but in new rows. An example of the output of a Spreadsheet report is shown in Figure 8.27. The default Rows/Columns arrangement can be transposed (see below the Rows/Columns arrangement option).
Important Note: With the Spreadsheet Batch Report, tokens are reported into the integrated Spreadsheet as plain text, not as actual tokens which means statistics will not update when gates/markers/quadrants are adjusted, or when loading a different iteration.

Figure 8.27 Example result of a Spreadsheet Batch Report
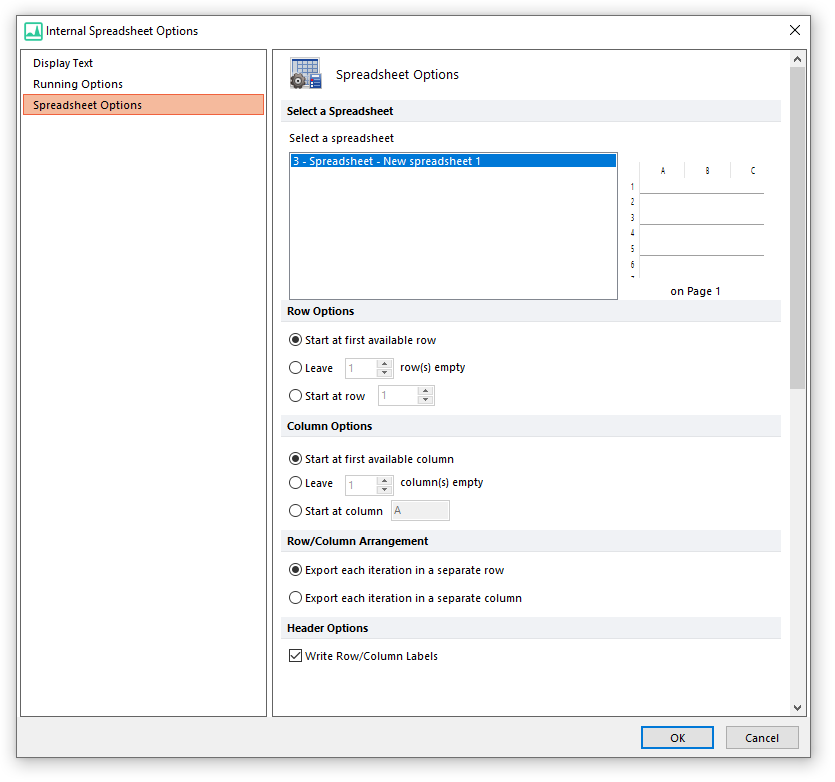
When an Export To Spreadsheet process is created, the Internal Spreadsheet Options dialog (Figure 8.28) opens. It has three sections:
•Spreadsheet Options
oSelect a Spreadsheet
The target spreadsheet can be selected between all the spreadsheets available in the layout.
oRow Options and Column Options
Row and Column options allow users to define at which row/column to start populating the spreadsheet with the selected statistics.
oRows/Columns arrangement
The Row/Column arrangement options define whether to export Iterations in rows and Statistics in columns or vice-versa.
oHeader options
The header options allow users to define whether or not to write the statistic header for each Row/Columns column.

Figure 8.28 Spreadsheet Batch Report File Options
