Unmixing from Single Stained Controls
In this section we will learn how to create an Unmixing Definition automatically from single stained controls. The raw spectral flow cytometry data files used for this section are located in the Tutorial Sample Data archive in the Unmixing Example folder. The example data set contains files for an Unstained Control, Multicolor Control, and seven single-stained controls for the following parameters: BV711, BUV737, BV650, PerCP-Cy5.5, PE-Cy5.5, APC-Cy7, and BV785.
1. Open a new layout in FCS Express by clicking New Layout on the Startup Screen or by choosing the File tab→ New→ New command from the Ribbon.
In this blank layout we are going to illustrate how to set up automatic unmixing. In order to use the automatic unmixing, you will need a single-stained control for every parameter that you wish to unmix as well as an unstained sample.
2. Select the File tab→Options→Data Loading→FCS Files Options→Instrument Specific Settings. In the list of Instrument Specific Settings, select Cytek - SpectroFlo. This section of the User Options contains the settings for working with Cytek spectral data. For a more detailed explanation of these settings, please see our manual.
In this tutorial, we will be referring to Spectral Parameters by their Parameter Names. This is the default setting for FCS Express. However, if instead your version of FCS Express displays the Spectral Parameters as Wavelengths, you can manually change this User Option. In the Cytek Specific Options, change the Spectra Parameter Label to Parameter Names. Click OK to apply the changes.
3. Select the Tools tab→Transformations section→Compensations and Unmixing command to open the Compensations and Unmixing window. To add a new Unmixing definition, click the black down Arrow ![]() next to the Add button (Figure T35.2) then click Unmixing.
next to the Add button (Figure T35.2) then click Unmixing.
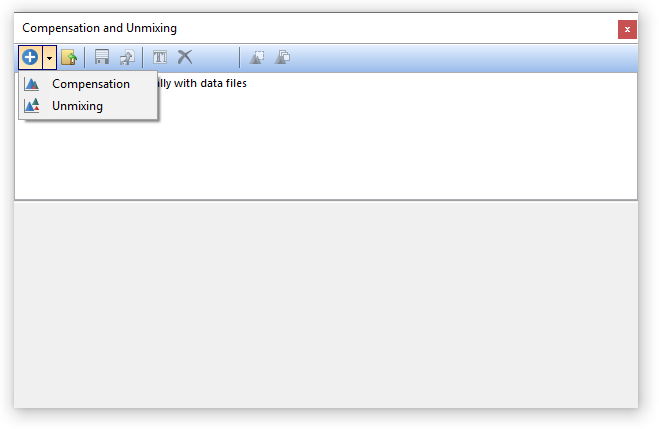
Figure T35.2 Add a new Unmixing definition.
The bottom pane of the Compensation and Unmixing window will automatically display the Automatic Unmixing Setup tab, and a text box in blue will appear with text New Unmixing (Figure T35.3).
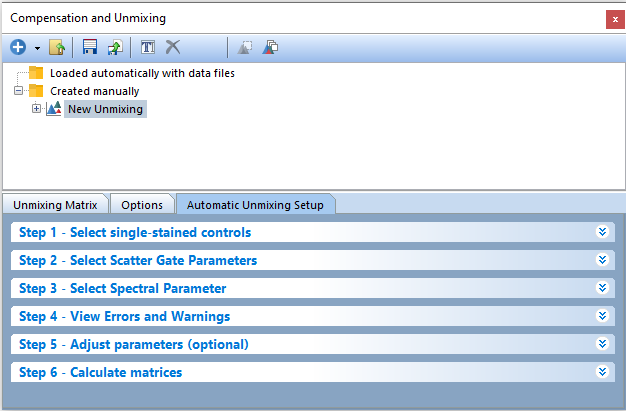
Figure T35.3 The Automatic Unmixing Setup tab.
4. Click on Step 1 - Select single-stained controls from the Automatic Unmixing Setup tab.
5. Click on the Add data for auto unmixing button, ![]() in the expanded window. The Standard Open Data Dialog will appear (Figure T35.4).
in the expanded window. The Standard Open Data Dialog will appear (Figure T35.4).
Multiple-select the following eight files from the Controls folder located within the Unmixing Example folder in the Tutorial Sample Data Archive:
a. CD3 BV711 (Cells).fcs
b. CD4 BUV737 (Cells).fcs
c. CD8 BV650 (Cells).fcs
d. CD16 PerCP-Cy5.5 (Cells).fcs
e. CD19 PE-Cy5.5 (Cells).fcs
f. CD45 APC-Cy7 (Cells).fcs
g. CD56 BV785 (Cells).fcs
h. Unstained (Cells).fcs
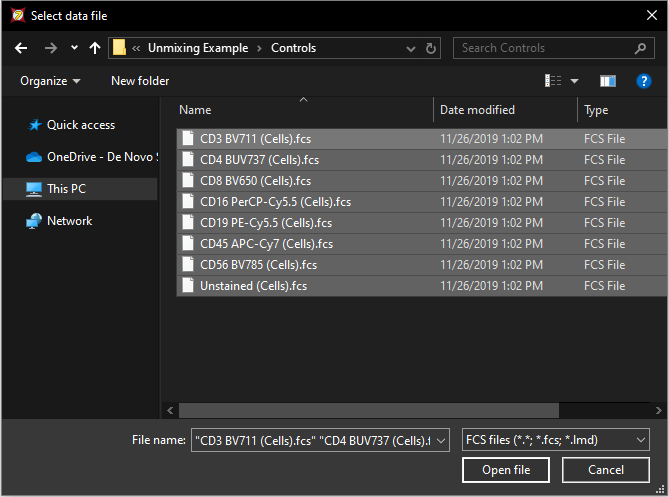
Figure T35.4 Use the Select Data File window to select all of the files for use in the Automatic Unmixing Setup.
6. Click Open file.
Notice all of the single-stained control files and the unstained control file have been loaded into the Select single-stained control window and have been assigned a Label, Sample Type, and Negative Control. You may change the Label and Sample Type per control as necessary. Changing the Label will result in the new label being displayed in all subsequent downstream steps of the Unmixing Setup, including as the parameter name in the Unmixing table and as the unmixed parameter name on plots.
When loading a universal negative, or unstained sample, the Sample Type is assigned automatically as Negative control and that negative is assigned for each single-stained control in the Negative control column (Figure T35.5). The Negative control can be adjusted manually by clicking within the cell and then on the downward arrow. A list of options will appear in the drop down window.
Note: The unstained control can be a universal negative, a negative population defined by a gate, or the negative population within the tube of the positive control.
For a more detailed explanation of the different Sample Types and Negative control options available, such as use self as negative controls, Autofluorescence controls, and no negative controls, please refer to the Unmixing section of the manual.
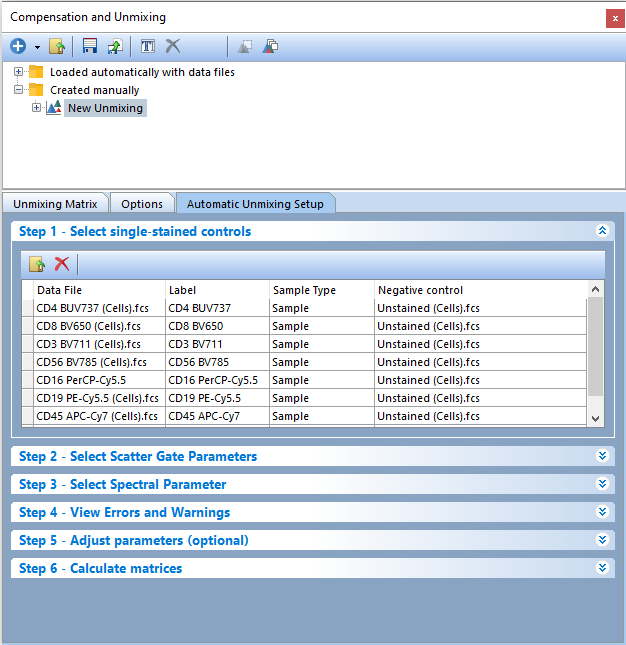
Figure T35.5 Step 1 - Files for controls have been added to the Automatic Unmixing Setup and are matched automatically to their respective parameters.
7. Click on Step 2 - Select Scatter Gate Parameters (Figure T35.6).
8. (Optional Step) Change parameters by clicking the down arrows to access drop down lists. By default, FCS Express will attempt to auto match to FSC-A and SSC-A. In this example, we will use the defaults of FSC-A for X Parameter for Scatter Gate and SSC-A for Y Parameter for Scatter Gate.
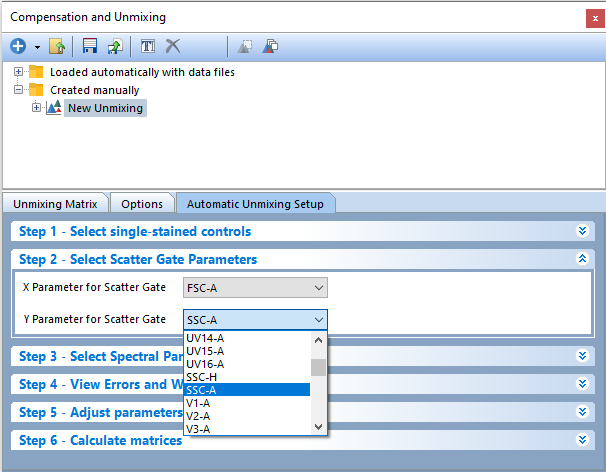
Figure T35.6 Step 2 - Select Scatter Gate Parameters for Automatic Unmixing Setup.
9. Click on Step 3 - Select Spectral Parameter (Figure T35.7).
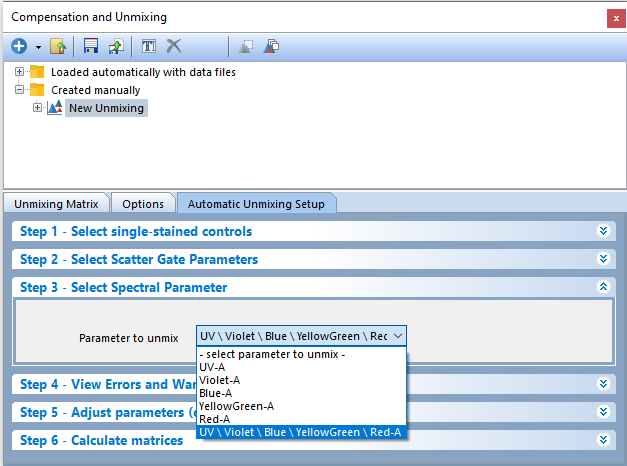
Figure T35.7 Step 3 - Select Spectral Parameter to Unmix.
10. Change the Parameter to unmix to UV\Violet\Blue\YellowGreen\Red-A by clicking the down arrow to access the drop down list. In this example, we will use the merged spectrum but any individual spectrums may be used when unmixing your own data sets.
Nine new pages will be created (Figure T35.8).
•Scatter Plot
•CD4 BUV737 control
•CD8 BV650 control
•CD3 BV711 control
•CD56 BV785 control
•CD16 PerCP-Cy5.5 control
•CD19 PE-Cy5.5 control
•CD45 APC-Cy7 control
•Unstained control
Figure T35.8 Tabs for new pages automatically created from Step 3.
The Scatter Plot page contains two plots displaying the parameters selected in Step 2 - Select Scatter Gate Parameters of the unmixing wizard, while the rest of the pages (single-stained and unstained control pages) contain a density plot, a histogram, and a spectrum plot for each parameter to unmix. On the histograms, a marker has been created automatically for each positive population.
Note that all of the histogram markers are children of the Scatter Gate, which means adjusting the Scatter Gate will cause the histogram markers to update in real-time. To view the gating hierarchy for your Scatter Gate and histogram markers, you may insert a Gate View.
On each histogram, the software will automatically detect and display the detector with the brightest peak. This detector is referred to as the brightest detector (red box, Figure T35.9). The wavelength or detector name (depending on the instrument specific settings) for the brightest detector will be reported on the X-axis title in parentheses and can be changed at any time by clicking on detector (Figure T35.9). Depending on your panel, you may need to change the brightest detector to match the instrument or dye manufacturer's recommendations.
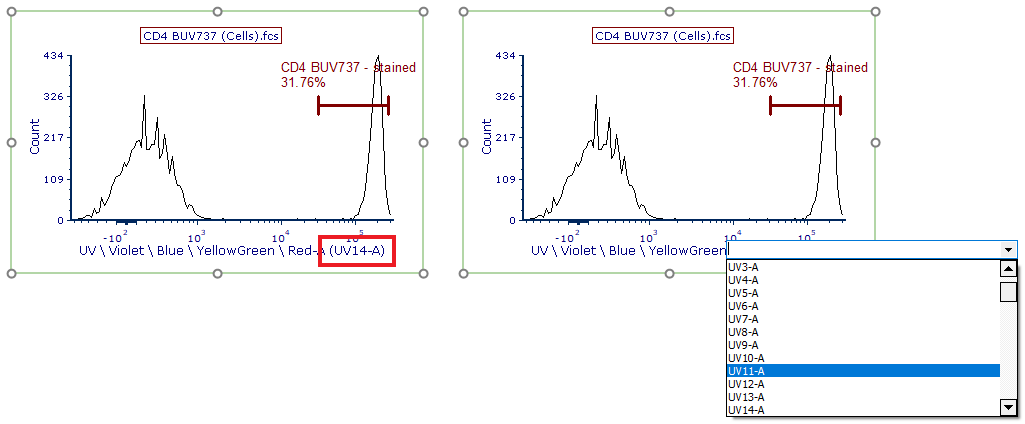
Figure T35.9 Changing the brightest detector for unmixing.
We will now adjust the Scatter Gate to refine the single-stained and unstained populations. Since FCS Express utilizes universal gating, meaning the gates belong to the parameters and not the files by default, updating the Scatter Gate's position on any plot will result in that gate updating its position on all other plots.
Note: The initial unmixing matrix is built from the default positions of gates and markers and any changes made will result in the unmixing matrix automatically updating.
11. Select the Scatter Plot page.
12. Click on the Scatter Gate (bottom left plot, see Figure T35.10). This plot shows data for Unstained (Cells).fcs, as indicated in the plot title. Adjust the gate position so that it resembles the plot on the right of Figure T35.11. Notice that the subsequent single stained control pages have updated to use this gate position.
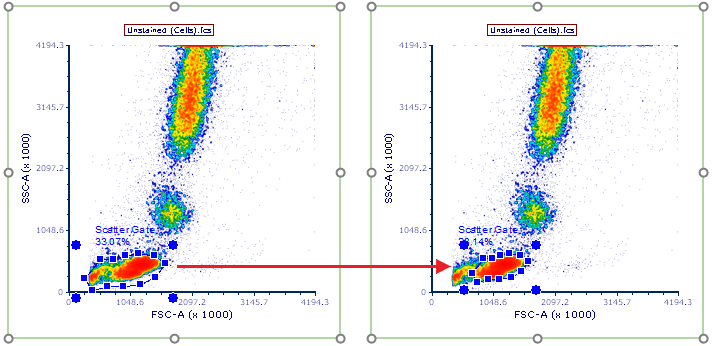
Figure T35.10 Adjusting the Scatter Gate to capture lymphocyte population stained by single stained controls.
Users may also decide to refine the marker positions in the following pages of the layout containing single stained control histograms. In the next few steps, we will be adjusting the marker positions for CD4 and CD8 to capture the brightest staining populations.
13. Select the CD8 BV650 control page.
On this page, the center histogram displays the positive population marker for CD8 BV650 (Figure T35.11, top left). Note the brightest detector for CD8 BV650 is V11-A, and was automatically displayed at the bottom of the histogram.
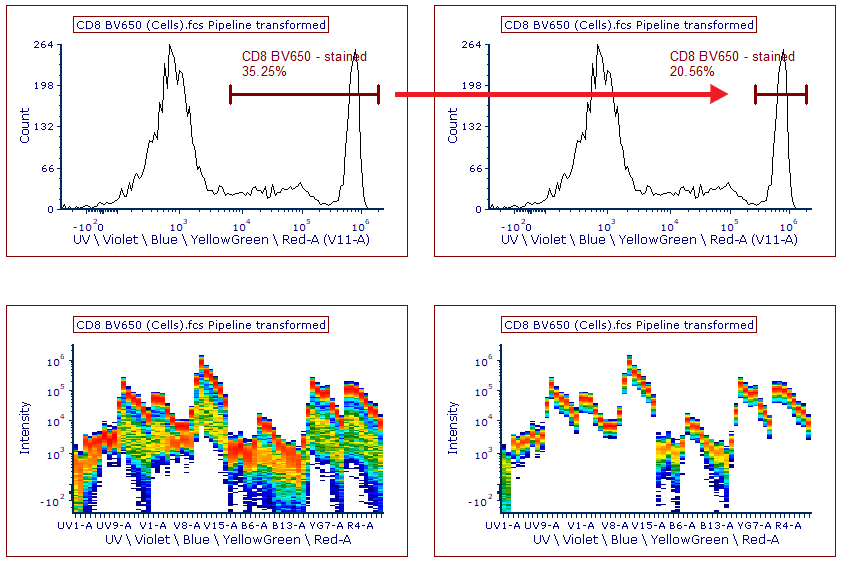
Figure T35.11 Adjusting the histogram marker for CD8 BV650 to best capture the positive staining population for spectral unmixing. (Left) Histogram and spectrum plot before marker adjustment. (Right) Histogram and spectrum plot after marker adjustment. Note the uniform and single spectrum.
On the spectrum plot beneath the histogram (Figure T35.11, bottom left), the spectrum is being displayed for the positive population captured by the CD8 BV650 marker. This spectrum plot is gated on the marker to allow you to check the quality of the automatically generated scatter gate and markers for each of your controls, as well as to check any custom gating strategy used for the unmixing. Spectrum that are unique and homogenous in their distribution across each detector are considered ideal for unmixing (i.e. clear single spectrum line).
14. Click and drag the lower marker boundary for CD8 BV650 - stained to the right so that it resembles the histogram at the top right of Figure T35.11.
Note the spectrum plot at the bottom right of Figure T35.11 is now a single unique nearly homogenous line.
15. Select the CD4 BUV737 control page.
16. Click and drag the lower marker boundary for CD4 BUV737 - stained marker to the right so that it resembles the histogram on the top right of Figure T35.12.
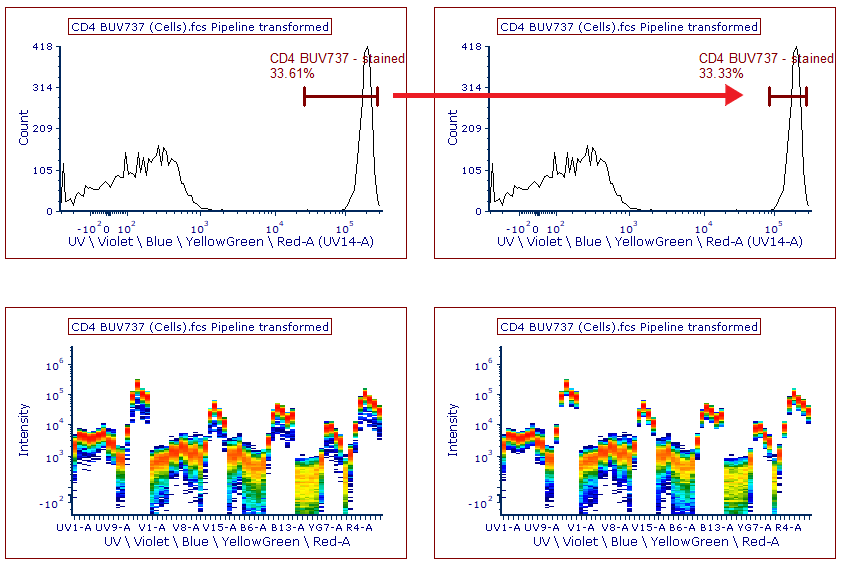
Figure T35.12 Adjusting the histogram marker for CD4 BUV737 to best capture the positive staining population for spectral unmixing. (Left) Histogram and spectrum plot before marker adjustment. (Right) Histogram and spectrum plot after marker adjustment. Note the uniform and single spectrum.
17. Select the CD16 PerCP-Cy5.5 control page.
CD16 is a marker present on the granulocytes population. As we have adjusted the Scatter Gate to capture only the lymphocyte population in Step 13, the CD16-positive granulocyte population is not represented in our Scatter Gate and thus not available to use as the positive staining population for our CD16 PerCP-Cy5.5 control.
For this example, we will be using the Data Specific Gate feature and show that by using the Spectral Plots we can properly unmix. In FCS Express, we can address moving gates between control samples with the use of the Data Specific Gate feature. Data Specific Gates allow you to adjust the gate size, position, and vertex coordinates for any gate on a file specific basis. For this tutorial, we will be adjusting the Scatter Gate for the CD16 PerCP-Cy5.5 control only, while leaving the Scatter Gate position intact for all other files.
18. Click on the Scatter Gate in the density plot at the top of the page. This plot shows data for CD16 PerCP-Cy5.5 (Cells).fcs, as indicated in the plot title (Figure T35.13, top left density plot)
19. While pressing and holding the Shift button, move the Scatter Gate so that it captures the granulocyte population (see Figure T35.13, top right density plot). The keyboard shortcut creates a Data Specific Gate. Notice that the histogram and spectral plots have updated on the page to use the new Scatter Gate position, while on all other pages of the layout the Scatter Gate remains on the lymphocyte population.
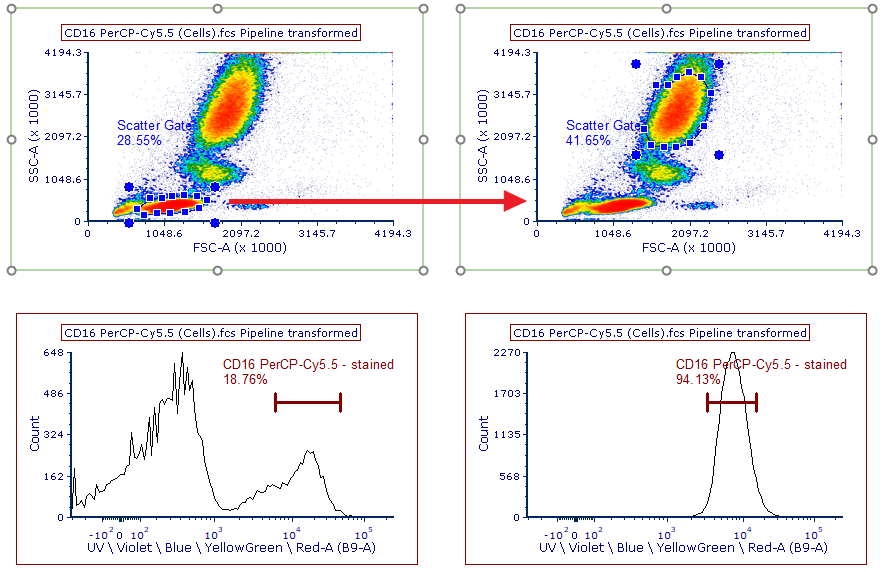
Figure T35.13 Using Data Specific Gates to adjust the Scatter Gate size, shape, and position for the CD16 PerCP-Cy5.5 single stained control only.
Note: After you perform step 19, the spectral signature still has an AF component (see Figure T35.14). If you move the histogram marker to the brightest tail of the histogram, the AF is somewhat removed and the end result will then look better.
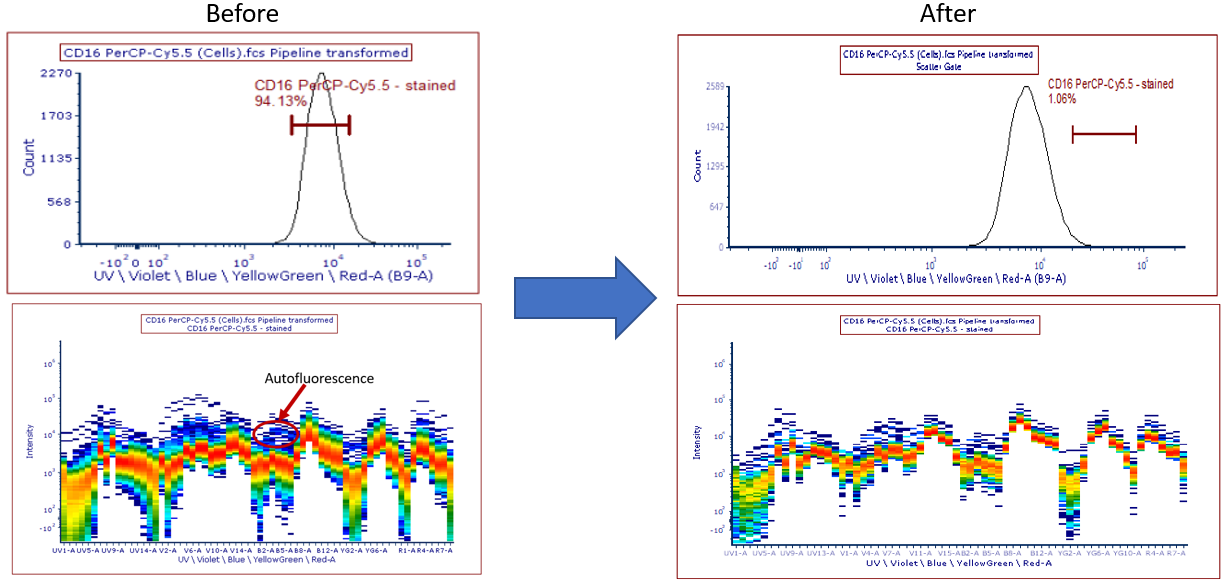
Figure T35.14 Changing the Scatter gate, Autofluorescence can be seen in the spectral signature.
20. Click on Step 4 - View Errors and Warnings (Figure T35.15).
If errors are found with the files or parameters you selected in the previous steps, an error message will appear here to indicate what the problem was, and the Scatter Plot and the single stained control layout pages will not be created until the error is corrected.
If there were no errors, the Successfully built histograms for AutoUnmixing message appears in the View Errors and Warnings dialog window.
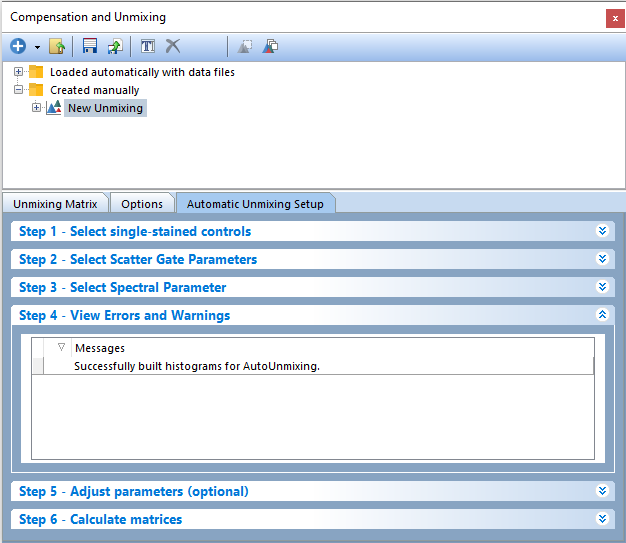
Figure T35.15 Step 4 - View Errors and Warnings will automatically display any errors that prevented the creation of new pages for each control containing a histrogram, spectrum plot, and density plot which allow the user to define the positive and negative populations to be used for the unmixing.
Step 5 of the Automatic Unmixing Setup is optional and will be skipped for this tutorial. Note that Step 5 allows users to manually define the stained and unstained populations to use for unmixing. Step 5 also allows users to change the detector assigned to a control / channel if needed.
21. Click on Step 6 - Calculate matrices (Figure T35.16). The Unmixing Matrix will be calculated automatically and displayed in the Unmixing Matrix tab of the Compensation and Unmixing editor after selecting spectral parameters to unmix in Step 3 - Select Spectral Parameter. A new Visualized Matrix page will also be automatically generated.
Note: If the checkbox next to Recalculate matrix automatically every time something changes is checked any changes made to gate or marker placements will automatically modify the resultant unmixing matrix. If this is unchecked click the Calculate matrices button (red box - Figure T35.16) to update the unmixing matrix after making changes.
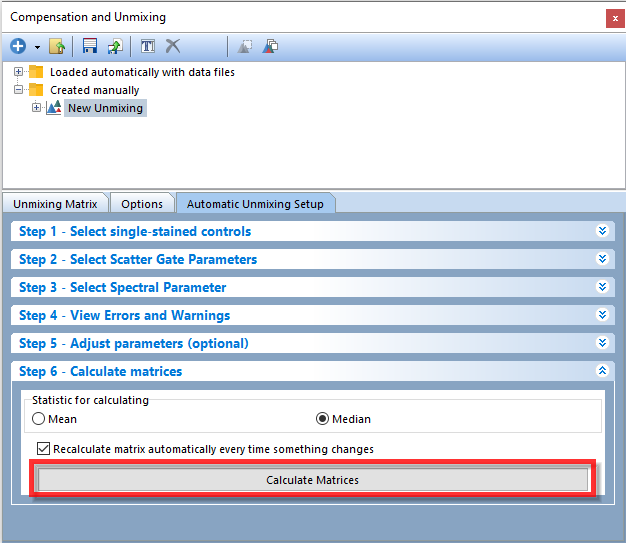
Figure T35.16 Step 6 - Calculate matrices
By default, each single stained control selected in Step 1 - Select single-stained controls will be included in the matrix, along with each detector. To exclude the contribution of any detector or control from your Unmixing Matrix, simply uncheck the box next to it.
Note: Your values may differ slightly from Figure T35.17 due to differences in how the Scatter Gate was positioned in previous steps of this tutorial.
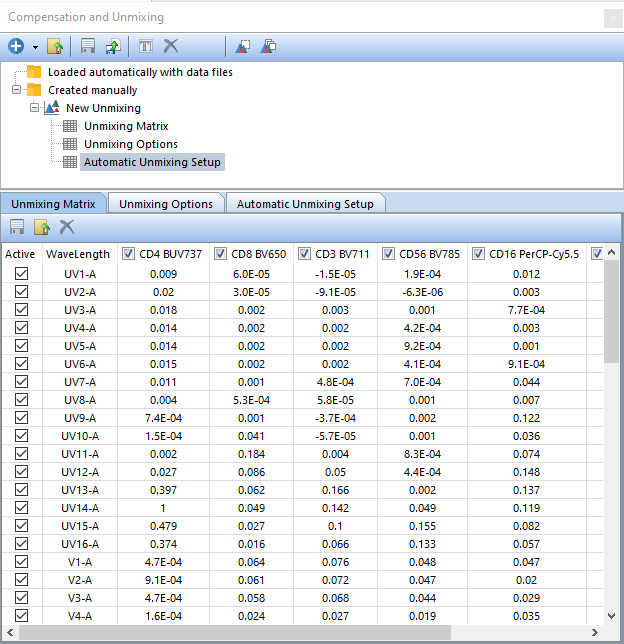
Figure T35.17 The Unmixing Matrix created from the Automatic Unmixing Setup.
We will now apply our new unmixing to a multicolor control.
22. Select the Data tab→Organize Data Sets→Data List command to open the Data List window. To add a new data file, click the Add button ![]() then click Add Data File (Figure T35.18).
then click Add Data File (Figure T35.18).
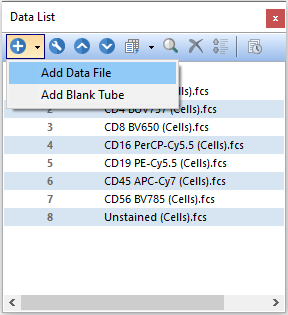
Figure T35.18 Add Data File from the Data List.
23. The Standard Open Data Dialog will appear. Navigate to the Multicolor.fcs file from the Multicolor folder located within the Unmixing Example folder in the Tutorial Sample Data Archive (Figure T35.19).
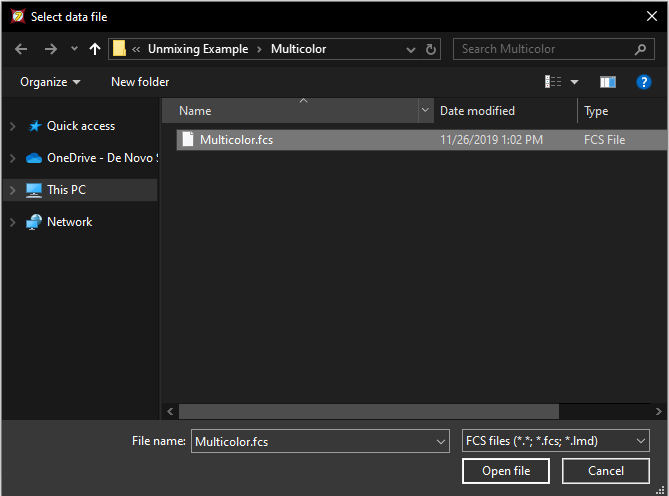
Figure T35.19 Use the Select Data File window to load the multicolor control file Multicolor.fcs
24. Click Open file.
25. Select the blue double left arrow icon ![]() at the bottom of the page and then click on the tab Page 1.
at the bottom of the page and then click on the tab Page 1.
26. Select Multicolor.fcs on the Data List. Next, drag and drop (by click and holding the left mouse button) Multicolor.fcs onto a blank space on the page. The Select Plot Types ... window will appear (Figure T35.20).
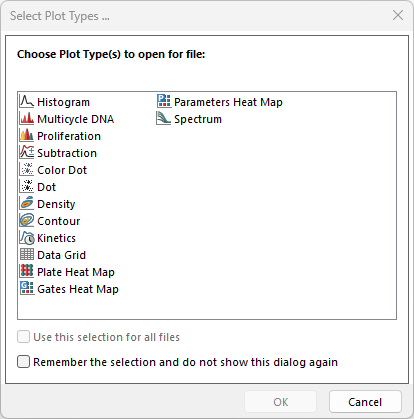
Figure T35.20 Select Plot Types... window.
27. Check the box for Density and ensure no other plot types are selected.
28.Click OK. A new density plot will appear on the page.
29. Select the New Unmixing from the Compensation and Unmixing window, then drag and drop (by click and holding the left mouse button) the New Unmixing on top of the Multicolor.fcs plot on the layout (see red arrow, Figure T35.21).
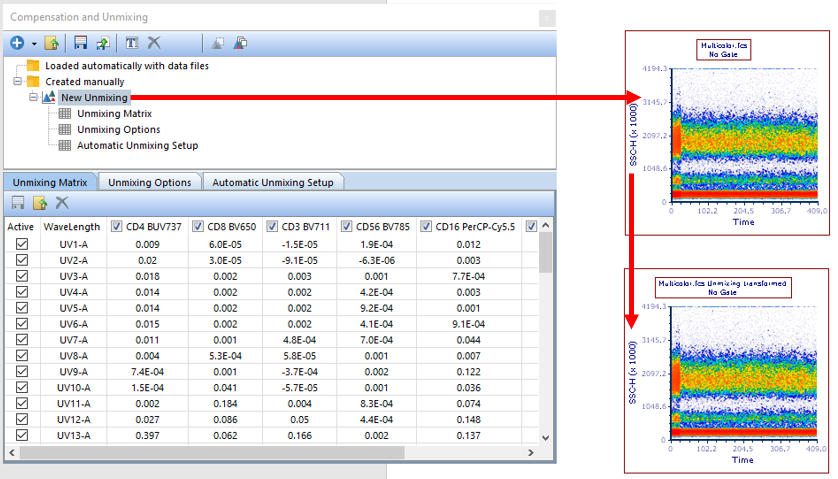
Figure T35.21 Apply the New Unmixing table to the Density Plot by drag and drop (red arrow). Once applied, the text "Unmixing transformed" will be appended to the title.
The plot will update with new text appended to the end of the title ("Unmixing transformed") and allow access to the properly unmixed parameters (see bottom right plot of Figure T35.21, red arrow).
30. Select the Density plot.
31. Click on the Gating tab.
32. Select Scatter Gate in the Create Gates→Current Gate dropdown list to apply the gate to the plot.
33. Click on the X-Axis title and scroll down to the bottom to view the unmixed parameters available (Figure T35.22).
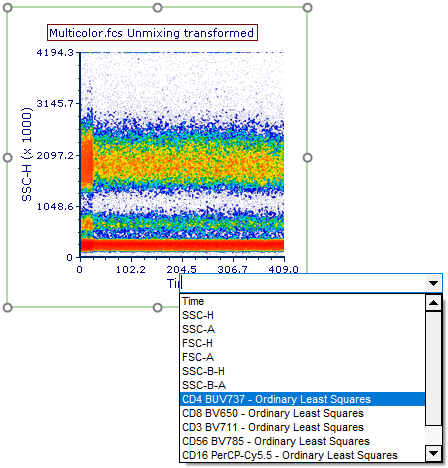
Figure T35.22 View the unmixed parameters by clicking on the axes titles and scrolling to the bottom. The unmixed parameters will be displayed as labeled in Step 1 of the Automatic Unmixing Setup.
Unmixed parameters will be indicated in the parameter list by the label provided in Step 1 (Label column) of the Automatic Unmixing Setup with the text " - Ordinary Least Squares" appended to the end.
In Figure T35.23, the unmixed parameters CD4 BUV737 - Ordinary Least Squares and CD8 BV650 - Ordinary Least Squares as displayed on the plot. Note that the new parameter suffix "Ordinary Least Squares" can be changed from the Options tab, along with the suffix added to Unmixed data in the plot title (see Figure T35.18).
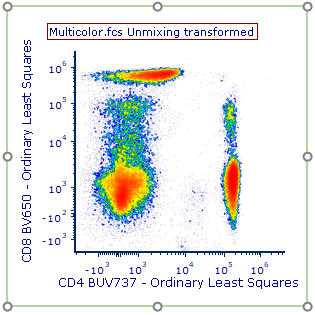
Figure T35.23 Unmixed Parameters for CD4 BUV737 and CD8 BV650 are displayed on the Density Plot.
We can also export our new unmixing table to archive and save it for later use. Note the recommended workflow for Automatic Unmixing is to perform the Unmixing in a separate layout, then export that matrix and load it into a new data analysis layout.
34. To export a new unmixing matrix definition, click the Save ![]() button (Figure T35.3) in the Compensation and Unmixing window. Unmixing definition files will be saved with the *.unmixing file extension.
button (Figure T35.3) in the Compensation and Unmixing window. Unmixing definition files will be saved with the *.unmixing file extension.
35. Type "UnmixingExample1" as the filename for the exported unmixing.
36. Click Save.
To import and use the new Unmixing defintion following the recommended workflow:
37. Open a new Blank layout (see Step 1).
38. Open the Compensation and Unmixing window from the Tools tab on the Ribbon.
39. Click the Import a transformation from a file ![]() button (Figure T35.3) in the Compensation and Unmixing window. The Load a Compensation window will appear.
button (Figure T35.3) in the Compensation and Unmixing window. The Load a Compensation window will appear.
40. Click on the dropdown at the bottom right of the window and change to Unmixing (*.unmixing) to view all Unmixing definition files in the folder (Figure T35.24). Select the file UnmixingExample1.unmixing and click Open.
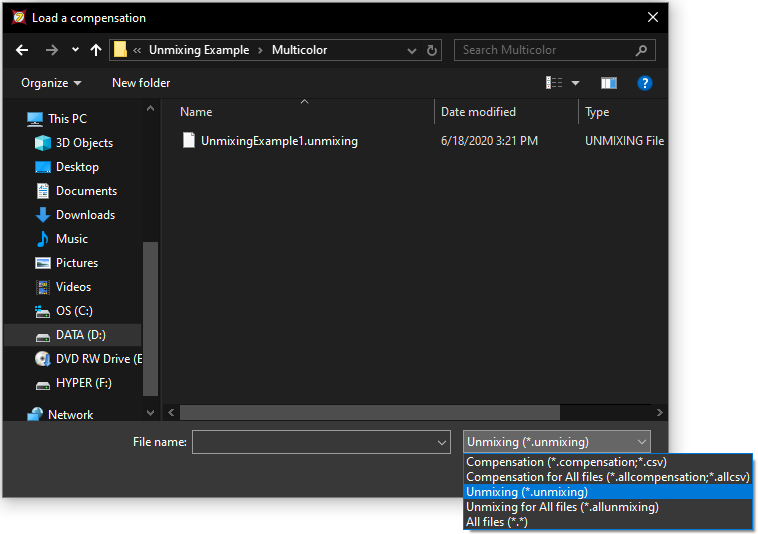
Figure T35.24 Importing an unmixing definition into a layout using the Compenation and Unmixing window.
The new unmixing will appear in the Created manually folder labeled as "New Unmixing" (Figure T35.25, red arrow). In FCS Express, an unmixing definition can be set as the Default for the layout. Setting an unmixing definition as the default will result in that unmixing definition being applied automatically to any new data file(s) or plot(s) added to the layout
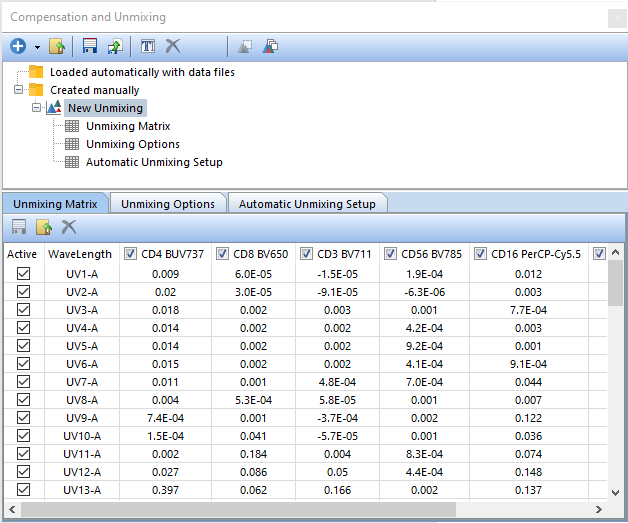
Figure T35.25 Imported Unmixing definition
41. Right-click on New Unmixing and select the option to Set As Default (Figure T35.26). The unmixing will now be labeled as New Unmixing (default) and will be applied to new data added to the layout as indicated above and specified in your Layout Options.
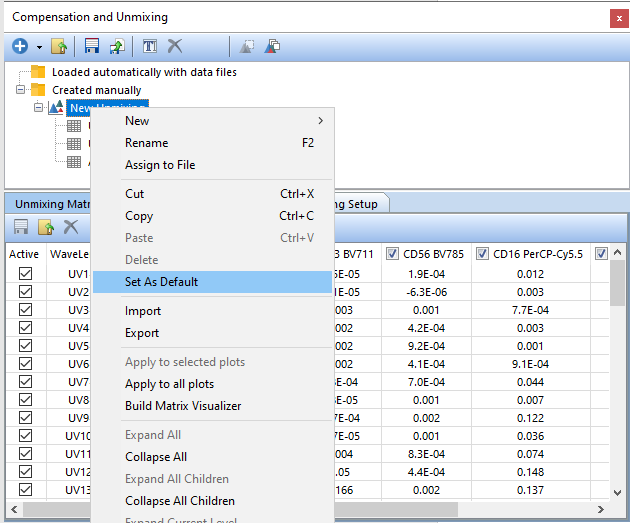
Figure T35.26 Setting an Unmixing Definition as the Default for the layout.
