Visualization

Contents
The table below describes the Visualization pipeline steps that are available in FCS Express. If you would like to recommend additional Visualization methods to be provided with FCS Express, please contact support@denovosoftware.com.
|
|
|---|---|
Step
|
Description
|
|
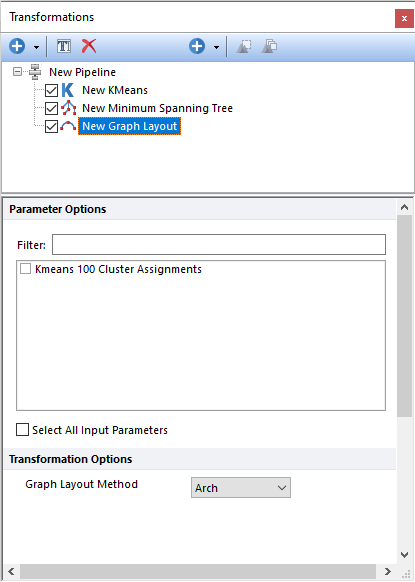
Graph Layout allows you to change the visualization of your Minimum Spanning Tree (MST) on a Heat Map plot using a MST output as input parameter. Using the Filter: field a user can remove unwanted parameter options from view to simplify selection.
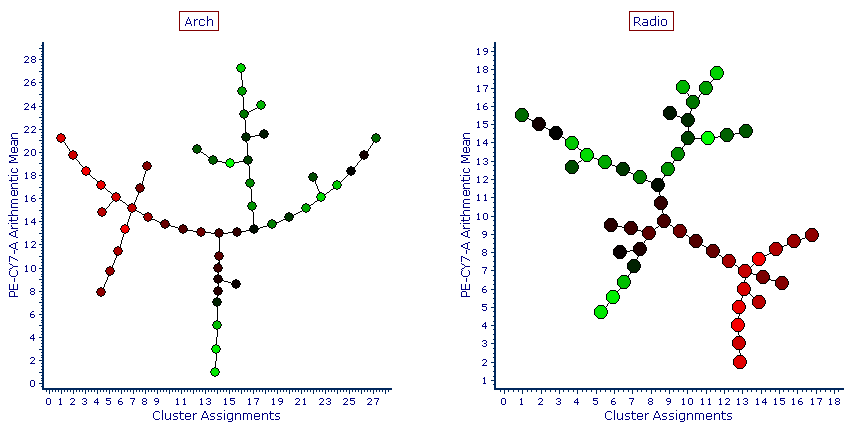
Two different Graph Layout Methods can be selected: Arch (also called "U-shape") or Radio.
Once the Graph is displayed on the Heat Map, the following actions can be performed on the Heat Map: •Have well size dependent on a statistic such as number of events in the node •Set the Parameter and Statistic for display •Change the Color Level and Color Scheme •Create gate(s) to identify node(s) of interest, and edit other features
|
|
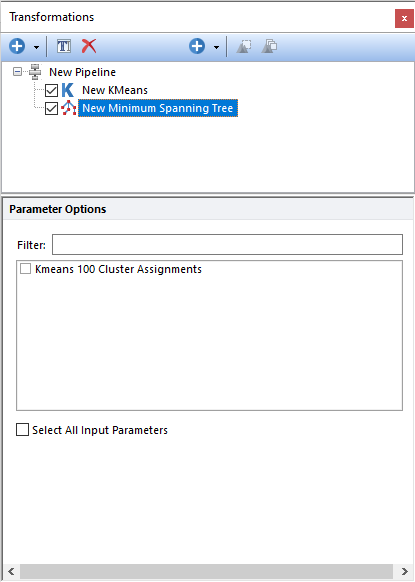
Creates a Minimum Spanning Tree (MST) using either a Cluster Assignment parameter or a Louvain Communities parameter as the input parameter. Please refer to the Clustering chapter for more details on how to generate Cluster Assignment parameters or Louvain Communities parameter.
Using the Filter: field a user can remove unwanted parameter options from view to simplify selection. The MST step generates a new parameter that can be visualize on an Heat Map plot. For more details on MST, please refer to this page on Wikipedia.
|
|
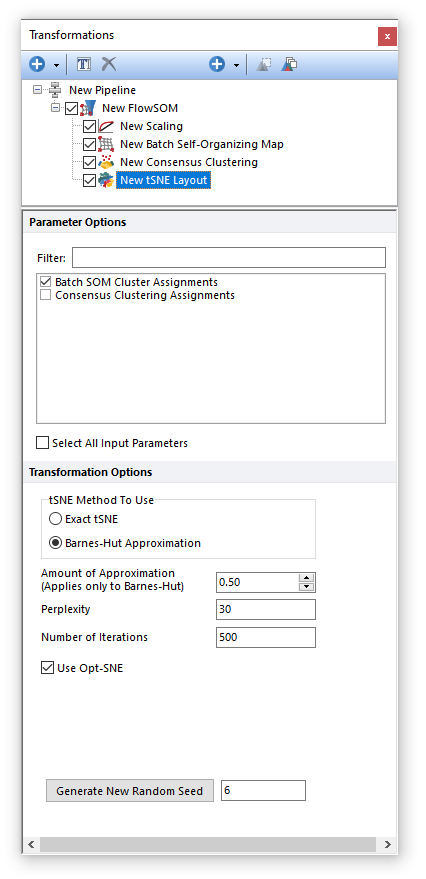
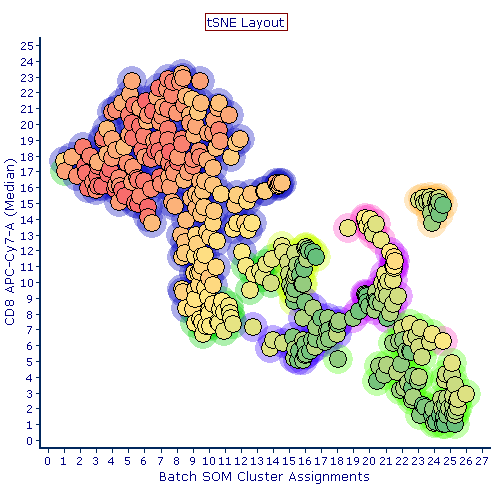
tSNE Layout allows you to change the visualization of your clustering parameter on a Heat Map plot using either a clustering assignment or a Minimum Spanning Tree as input parameter. The tSNE Layout organizes cluster nodes with on a tSNE map. tSNE coordinates for each cluster are calculated based on the location of each cluster in the multidimensional space. Using the Filter: field a user can remove unwanted parameter options from view to simplify selection.
Please refer to the tSNE pipeline step for more details on the settings available to tune the tSNE algorithm.
In the example pipeline below, a tSNE Layout pipeline step has been used to map clusters generated by a Batch Self-Organizing Map clustering step.
In the Heatmap below, an example of clusters mapped with a tSNE Layout is depicted.
|
|
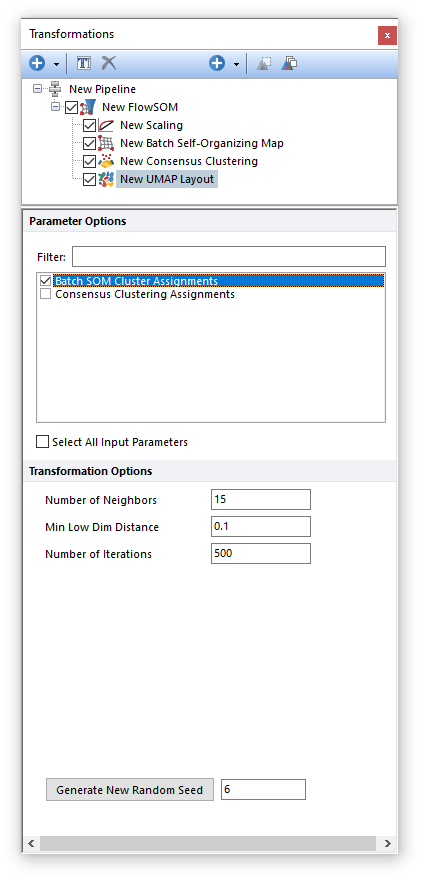
UMAP Layout allows you to change the visualization of your clustering parameter on a Heat Map plot using either a clustering assignment or a Minimum Spanning Tree as input parameter. The UMAP Layout organizes cluster nodes with on a UMAP map. UMAP coordinates for each cluster are calculated based on the location of each cluster in the multidimensional space. Using the Filter: field a user can remove unwanted parameter options from view to simplify selection.
Please refer to the UMAP pipeline step for more details on the settings available to tune the tSNE algorithm.
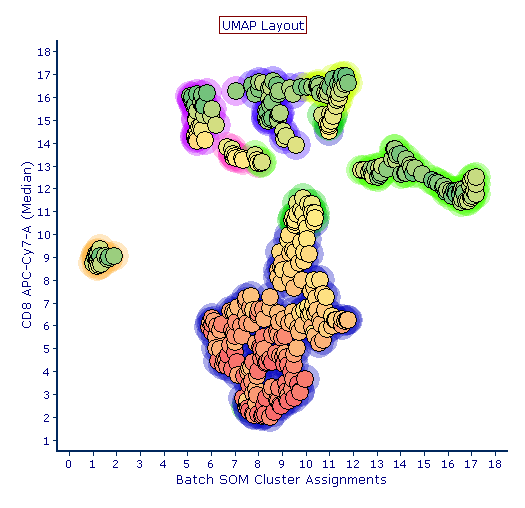
In the example pipeline below, a UMAP Layout pipeline step has been used to map clusters generated by a Batch Self-Organizing Map clustering step.
In the Heatmap below, an example of clusters mapped with a UMAP Layout is depicted.
|