Batch Processing and Reporting for Image Data
In this section, we will learn how to:
•Open a layout and configure a batch process for several wells in a 96-well plate
•Configure the Batch Processing Actions to export the batch results as reports
•Pause between wells to confirm the current iteration of the batch is being analyzed correctly
•Reconfigure the batch to run in an automated fashion
•Export a high resolution image from the layout for publication purposes
•Export the layout to a PowerPoint
•Export the layout to .PDF
Important note before starting: With the release of FCS Express 7.18, Picture plots display images at their original zoom originating from the top-right corner of the image. Both the zoom and region of the image displayed in the Picture plot can be customized (please refer to the Zooming/Panning Specific Options for Picture Plots section of the Working with Picture Plots chapter for more details). Depending on the release of FCS Express you are using, screenshots in the section below may differ from what you see in FCS Express but the results will be the same. Zooming/panning settings may be adjusted as needed by the end user at anytime in the tutorial
We will use the IntroToImage4.fey layout, which is located in the Intro to Imaging Tutorial subfolder found in the Tutorial Sample Data archive. This layout contains a detailed per-formatted approach to batch processing and report generation with image data.
For this section, we will use data generated on the Molecular Devices ImageXpress Velos system (previously called "IsoCyte"). The ImageXpress Velos System is a high-speed cytometer, which performs whole well imaging for an entire multiwell plate. Cells are typically 10-20 pixels each and appear as small dots within a whole well image. This system can scan plates in as little as 3 minutes enabling high throughput image-based cytometry. It is ideal for cytometric analysis of adherent cells that are difficult to study in suspension with Flow Cytometers.
The ImageXpress Velos data is fully compatible with FCS Express 6 Image Cytometry. As we will show in this tutorial, preferences can be set to immediately import and open data from the ImageXpress Velos into FCS Express. You will see images and 2D plots from an Live/Dead experiment run in a 96-well plate. We will review one row of data from the plate for this experiment using a previously saved layout for the tutorial. This single row includes a dilution series of a compound that results in a range of all live to all dead across the wells. Live cells are stained with a dye identified as "IMEAN-1," and dead cells with another dye identified as "IMEAN-3."
We first will check the user options and then open the IntroToImage4.fey layout to learn how to import and load data into the Data List.
Section 1: Checking User Options and Preparing a Batch Analysis (If you have completed Section 1, please skip to Section 2. If you have completed Sections 1 and 2, please skip to Section 3. If you have completed Sections 1, 2, and 3, please skip to Section 4.)
1. Click File tab→Options.
2. Expand the Data Loading category by click the + ("plus" sign) and choose the ImageXpress Velos options subcategory in the left pane of FCS Express User Options dialog (Figure T30.50, orange highlight text).
3. Confirm the only box checked is next to "Load images" option under IsoCyte Reader Options. It is only necessary to load data as a plate when working with the High Content module. Do not load data as a plate when planning to run a batch analysis for individual wells of a plate. If batch processing through multiple multiwellplates, check the box next to "Load as Plate" option and do not set to load images, unless you need them.
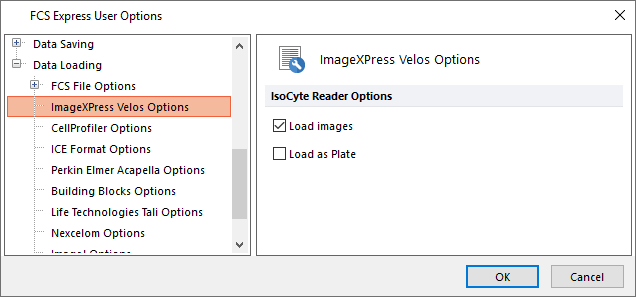
Figure T30.50 Correct Data Loading Settings
4. Click OK.
5. Select File tab→Open.
6. Browse to and select IntroToImage4.fey layout from the Intro to Imaging Tutorial subfolder of the Tutorial Sample Data archive.
You will see a template for analysis and reporting of data from Live/Dead Assays run on the ImageXpress Velos. The Batch Setup page of the layout will have an empty Data List, four unpopulated plots, an empty summary data table at the top, a Gate View, and a date stamp in the lower right for Analysis Date (Figure T30.51).

Figure T30.51 Empty Layout
7. In the Data List, click the ![]() button and choose Add Data File.
button and choose Add Data File.
8. Choose ImageXpress Velos files (*.iso) from the Files of Type: drop-down list in the Select data file dialog (Figure T30.53, red outline).
9. Open the ImageXpress Velos With Image subfolder to open Live_dead_96.well.iso subfolder within the Tutorial Sample Data archive (Figure T30.53).
10. Select all the Live_dead_96[...] files.
11. Click Open file.
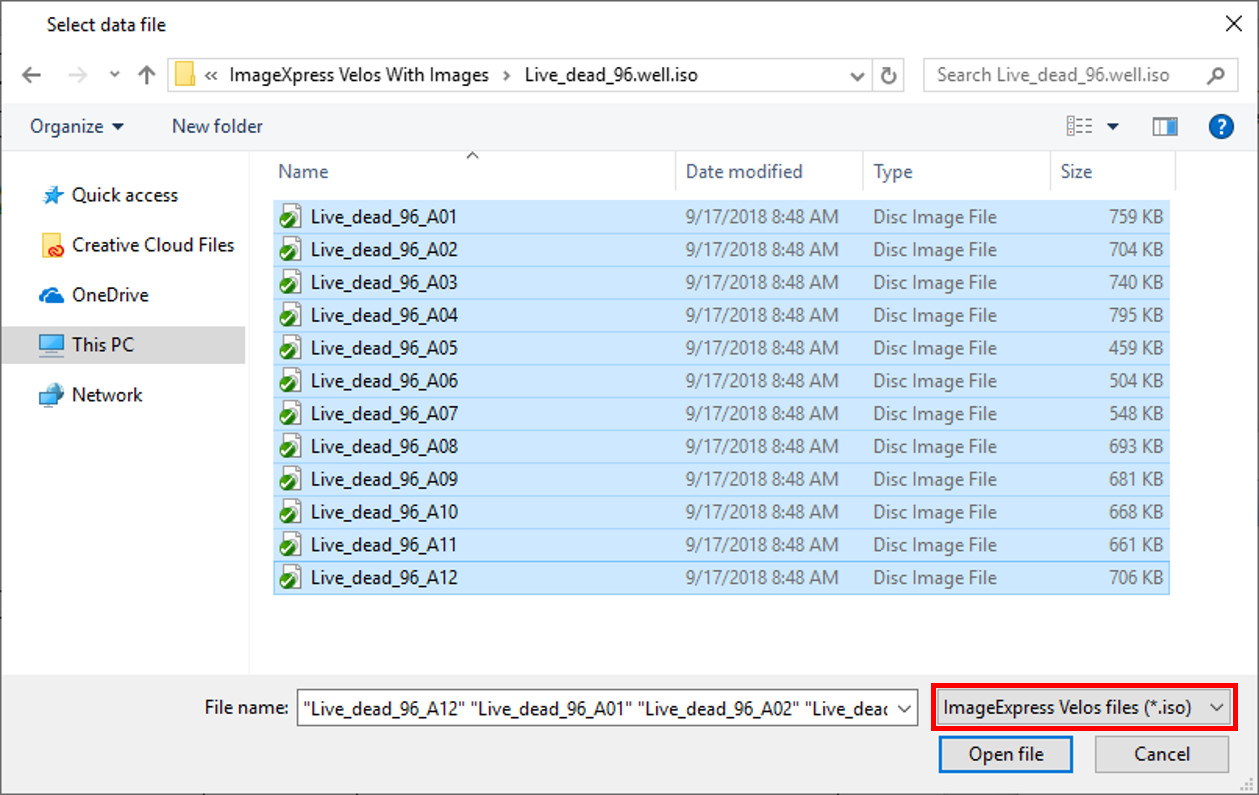
Figure T30.53 Selecting the Data Files
The Data List now will contain data from the 12 wells (A01-A12) of the Live/Dead Assay (Figure T30.54).
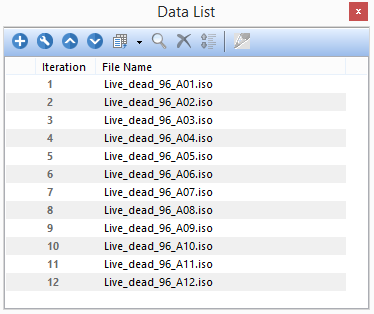
Figure T30.54 Data List showing Data Files
12. Click to select the first file in the Data List (Figure T30.55, blue highlighted text).
13. Click on the Change data drop-down in the Data List (Figure T30.55, fifth icon).
14. Select Change Data On All Plots (Figure T30.55, light-blue highlighted second option).
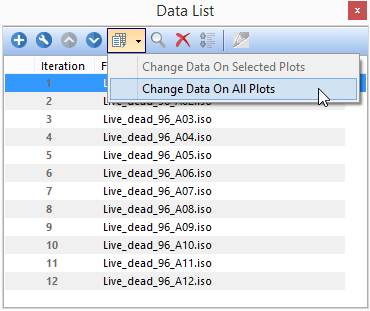
Figure T30.55 Loading First Data File into Layout
All the objects on the layout should be populated with data from Live_dead_96_A01.iso (first file in the Data List) as shown in Figure T30.56).
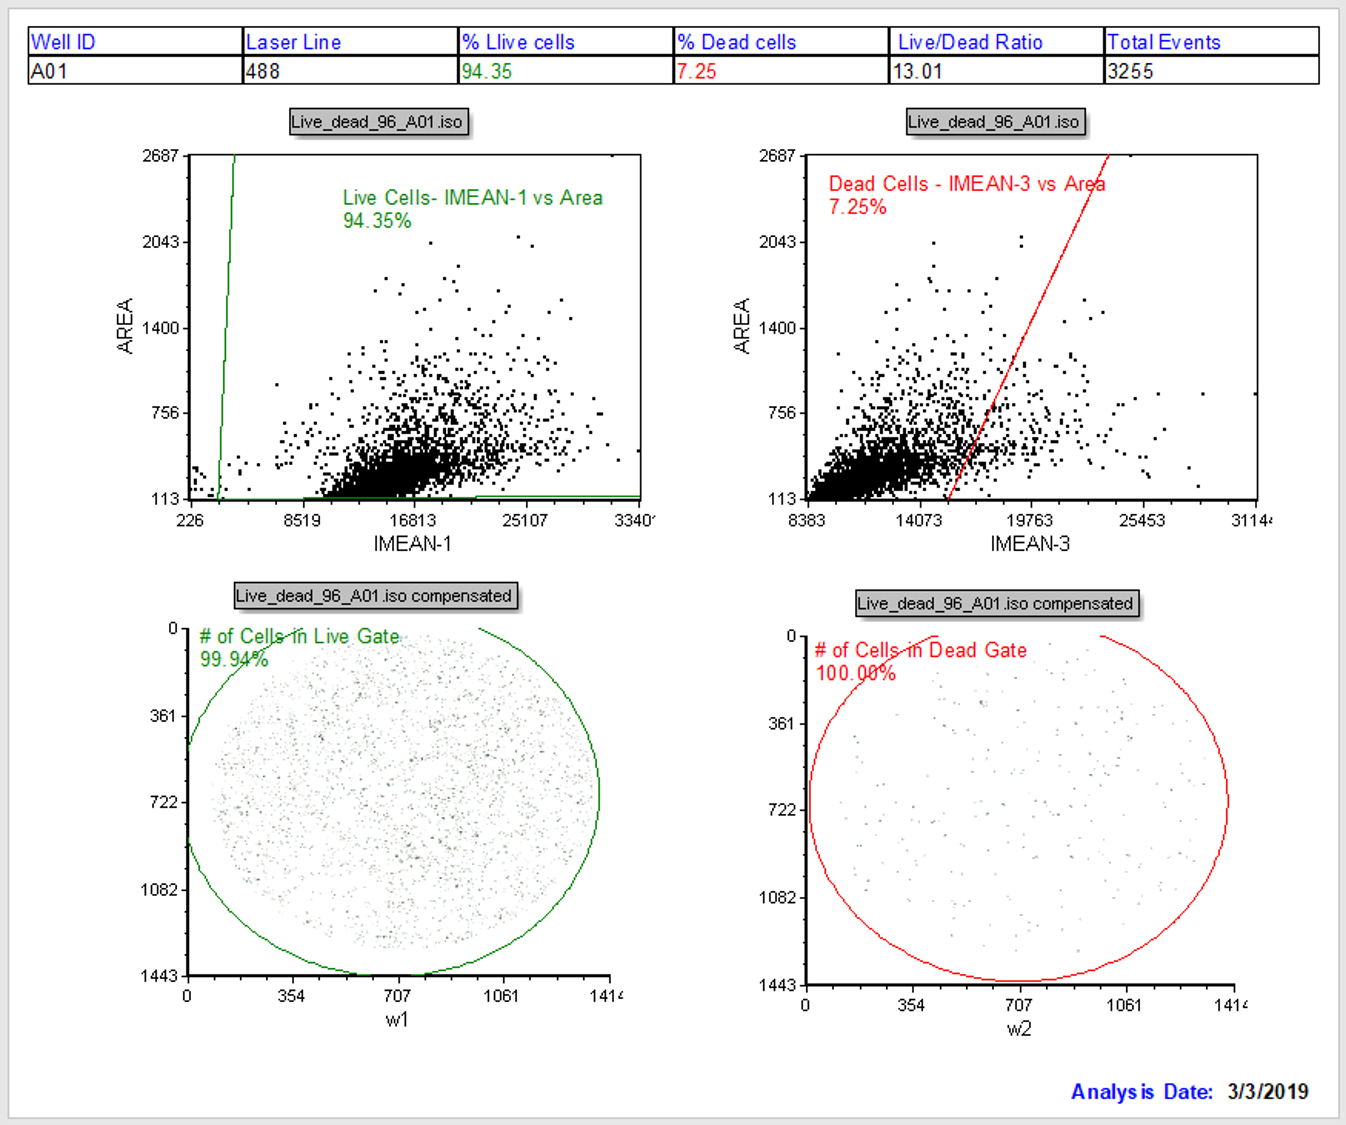
Figure T30.56 Well A01 Displayed in Layout
We will review the entire Batch Setup page of IntroToImage4.fey again. Notice the page is configured with a summary table at the top and four plots (Figure T28.60). Two dot plots on the top indicate the Live and Dead cell channels, respectively for the given well. The left and right picture plots at the bottom of the page are the live and dead images, respectively. Live Cells and Dead Cells gates have been created prior to this tutorial. Tokens on the dot plots calculate and show the percentage of live and dead cells. Additional gates (# Cells in Live/Dead) count total number of events in each of the fluorescent channels. Observe in the data table at the top of the page is showing data from well A01 as noted in the left-most column of the table (Figure T30.57).

Figure T30.57 Data Summary Table
Now, we will increment through the samples in the data list.
15. Click the blue number 2 from the Iteration column in the data list.
16. Repeat step 15 for Iterations 3 through 12. Observe how all the objects on the layout update to display the selected iteration.
17. Click the blue Iteration number 1 in the data list to return to displaying the first data file.
Next, we will learn how to close and reopen the Data List window.
18. Close the Data List by clicking the "X" in the upper right corner of it.
19. Reopen the Data List by clicking the Data tab→Organize Data Sets group→Data List command in the ribbon ![]() .
.
We now will demonstrate creating a summary table.
20. Click the Insert tab→General group→Text Box command in the ribbon ![]() .
.
21. Click anywhere on the layout to insert the new text box.
22. Right-click inside the text box.
23. Select Table→Insert Table (Figure T30.60).
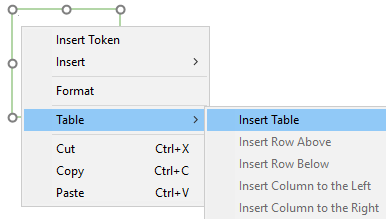
Figure T30.60 Inserting a Table into Text Box
The Insert Table dialog will appear, allowing you to create a table of any size and dimension (Figure T30.61).
24. Enter 5 in the edit field for Number of columns:.
25. Click Cancel to avoid creating a new table since steps 20 through 24 illustrate adding a new table.
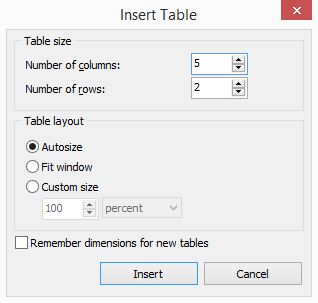
Figure T30.61 Insert Table Dialog
26. Delete the text box added from steps 20 and 21.
27. Click on the "Well ID" text in the cell in the upper left hand corner of the summary table (Figure T30.62).

Figure T30.62 Summary Data Table
28. Edit the "Well ID" text as you would in Word, Excel or PowerPoint.
29. Undo your edits with Cmd+Z commands until the "Well ID" text is restored.
30. Select the A01 text in the lower left hand box of the summary data table using standard Windows selection techniques. The grey background of the A01 text indicates it is a Token. Notice the text turns white when selected (Figure T30.63).

Figure T30.63 Selecting a Token
31. Double-click on the A01 Token.
The Edit Keyword dialog will appear (Figure T30.64).
32. Select the Keyword category to choose a token displaying a Keyword from the data set (Figure T30.64, orange highlighted text).
33. Click on the ellipsis ![]() button (Figure T30.64, red outline).
button (Figure T30.64, red outline).
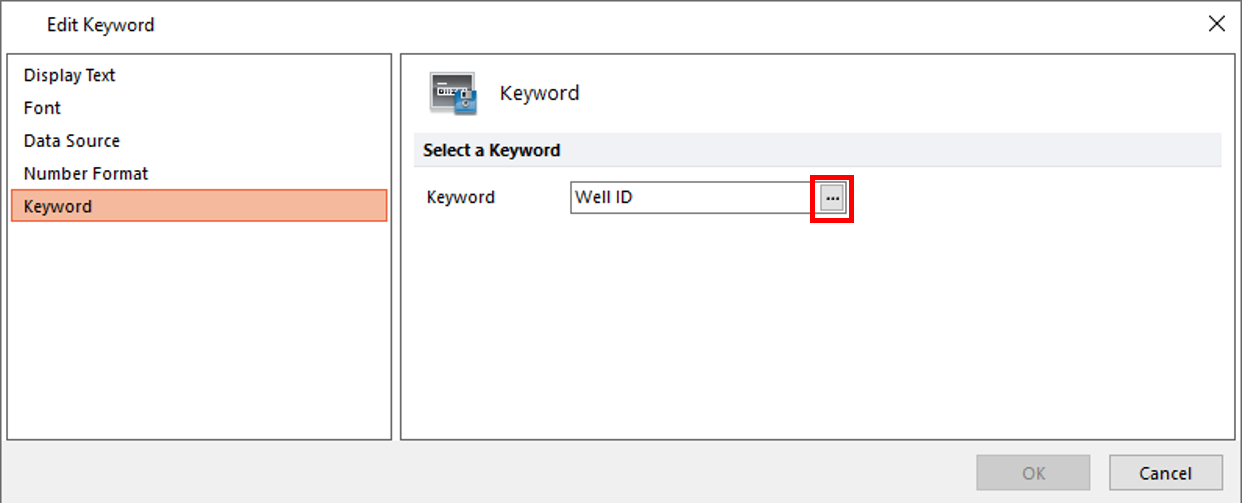
Figure T30.64 Edit Keyword Dialog
The list of the available keywords appears in the Please select a keyword dialog (Figure T30.65).
34. Select Well ID from the Please select a keyword dialog (Figure T30.65, blue highlighted text) and click OK.
35. Click OK to close the Edit Keyword dialog.
You have confirmed the Well ID as keyword to be printed in the Well ID column of our Summary table.
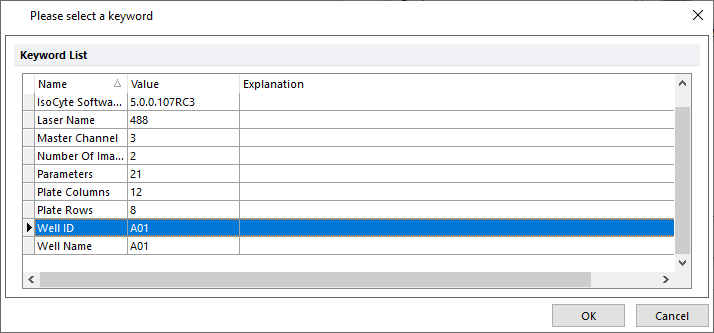
Figure T30.65 Confirming WellID Keyword is Used in Summary Data Table
Optional: You may repeat steps 31 through 35 to edit the token used for "Laser Line," replacing it with "Master Channel" keyword in the second column, to gain more experience with keyword tokens. Please undo any these optional steps if performed before continuing.
In this report layout, all of the values in the lower row of the Summary Data Table are Tokens, which have been placed in the cells to add dynamic data into the table. We have inserted the keywords for Well Name and Laser Name from the ImageXpress Velos data into the first 2 cells.
Note we can label the columns of the summary data table as preferred since they are free text. We use these rather than the default names from the metadata, "Well Name" and "Laser Name," respectively for added clarity in the report. The other values in the table are tokens to report calculated values from specific gates.
For example, the % Live cells and % Dead cells values are tokens displaying the percentage of cells residing in the respective Live Cells and Dead Cells gates. The Live/Dead Ratio Token is a "custom token" to create a ratio of two existing values (% live / % dead) that are derived from the gates. We will not discuss Custom Tokens in detail here. For a complete tutorial on using Tokens, please see "Text Boxes and Tokens" or review the "Using Tokens" section of the manual. We will not make any additional changes to Tokens used in the table.
36. Select all of the text in the Summary Data Table by clicking and dragging over all the cells of the entire table. Alternatively, click in any cell of the table and use Cmd+A to select all text in the table (Figure T30.66).

Figure T30.66 Selecting all Text in the Summary Data Table
37. Select the Text tab as shown in Figure T30.67.
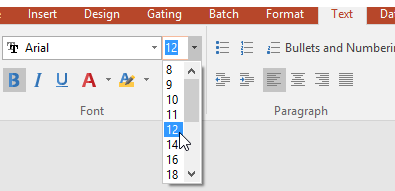
Figure T30.67 Editing Font Properties from Text Tab on Ribbon
38. Change the size of the font in the table from 10pt to 12pt as shown in Figure T30.67 above.
39. Click on the "B" (bold) button to change all the text to Bold as shown in Figure T30.67 above.
Notice you have similar options for editing text in a layout page as you would expect in any Microsoft product. This allows layouts to be customized in any way you require for custom reporting.
40. Click anywhere on the summary data table to remove the highlighting for the selection and view changes (Figure T30.68).
Figure T30.68 Summary Data Table All Cells Modifed to Bold and 12pt Font
Section 2: Configuring a Batch Analysis for Image Data
We now will configure a batch analysis and run through it to create a report to export from FCS Express. In this example, the settings for the batch were setup previously. We will review them, and then run the batch several ways. Please see the tutorial on Batch Processing for detailed instructions on setting up a batch process and configuring advanced reports.
41. Click on the Batch tab→Batch Processing group→Batch Actions command  .
.
The Batch Actions window will appear as shown in Figure T30.70.
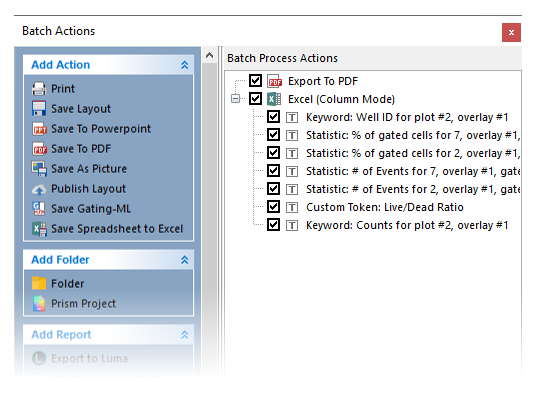
Figure T30.70 Batch Process Actions for Layout
Notice in the Batch Actions menu that there are many actions and reports that can be set up in a batch process (Figure T30.70). We will not review setting up a new batch process in this tutorial. Once configured, batch processing of data and report generation occur simultaneously and can be exported in a variety of formats. For additional information on creating reports, refer to the Batch Processing tutorial.
Observe in the Batch Process Actions window that it is pre-configured to run batch analysis for each well in the Data List, and export information to both a PDF and an Excel spreadsheet. The PDF will show what we see in the Batch Setup Page, and the Excel file has been configured to log specific values to the spreadsheet automatically during the batch run. Items to be exported to Excel are listed.
To demonstrate the ease of configuring batch output, we will add one additional variable to the output for the Excel spreadsheet using drag and drop capabilities for tokens.
42. Select the token for Total Events in the summary data table on the Batch Setup page of the layout. Recall from that the token will appear in white when selected properly (Figure T30.71).

Figure T30.71 Selecting the Token for Total Events
43. Click the highlighted token and hold mouse button down.
44. While holding mouse button down, drag it onto the Excel (Column Mode) text in the Batch Process Actions window (Figure T30.72, indicated by arrow).
45. Release the mouse button when you see a "+" sign on the cursor (Figure T30.72).
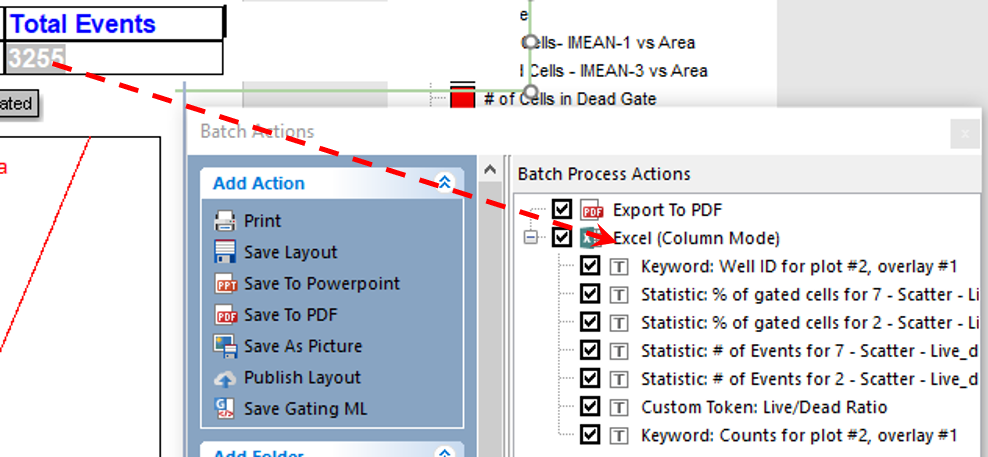
Figure T30.72 Drag and Drop to Add Token to Excel (Column Mode) Batch Action
Note a new item has been added to the Excel (Column Mode) report in the Batch Process Action section (Figure T30.73, blue highlighted text).
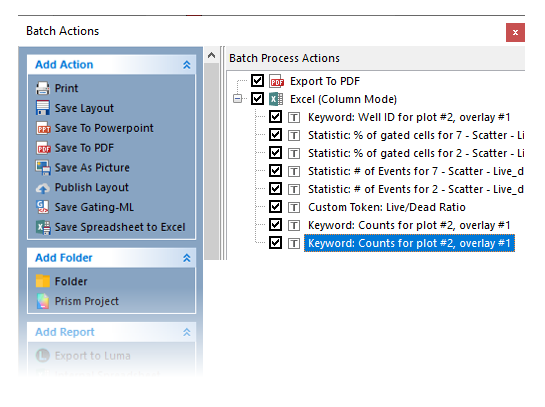
FIgure T30.73 Newly Added Report Item for Excel (Column Mode) Batch Action
Please note that the newly-added keyword is a duplicate since the exact same item was added to the list previously. In order to avoid duplicates, remove the first Keyword: Counts for Plot #2, overlay #1 (the one directly above the one highlighted in blue in Figure. T30.73 above) by clicking it and keying Delete on your keyboard.
Now, we will modify the token added from steps 42 through 45..
46. Double-click on the last item in the list, Keyword: Counts for Plot #2, overlay #1.
The Excel (Column Mode) field [...] dialog will appear (Figure T30.74).
47. Select the Field category (Figure T30.74, orange highlighted text).
The Column Name edit field will be empty
48. Enter "Total Events" into Column Name field (Figure T30.74).
49. Click OK. You have named the respective column header for the Excel file export as "Total Counts."

Figure T30.74 Editing the Column Name Field
This token has now been added to the excel export report. For each well, the actual values will be logged into an Excel table, and we have edited the column header that will appear as "Total Events" in the report. You may turn off any Batch Action by unchecking the box next to the item to not participate in the batch process. We will not discuss configuring batch analysis in more detail in this overview tutorial. For a more detailed tutorial on Batch Processing, please see the tutorial titled Batch Processing. There also is a detailed section in the manual on Batch Processing.
We now define the paths to save our PDF and Excel reports to the desktop when the batch process runs.
50. Double-click on Export to PDF in the Batch Actions window (Figure T30.75, blue highlighted text).
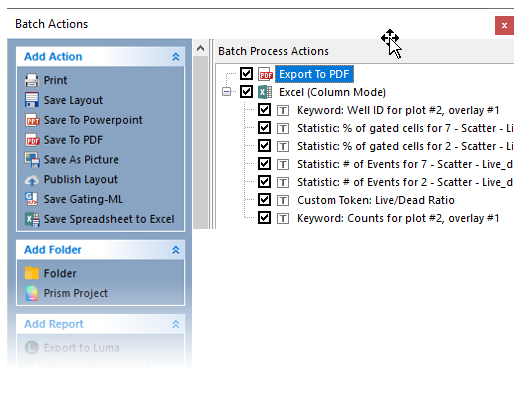
Figure T30.75 Editing the PDF Export Settings
The Edit Export to PDF Action dialog will appear (Figure T30.76).
51. Click the folder icon ![]() next to the Save to a new file: edit field under the Output file options to select where to save and name the file (Figure T30.77, red outline).
next to the Save to a new file: edit field under the Output file options to select where to save and name the file (Figure T30.77, red outline).
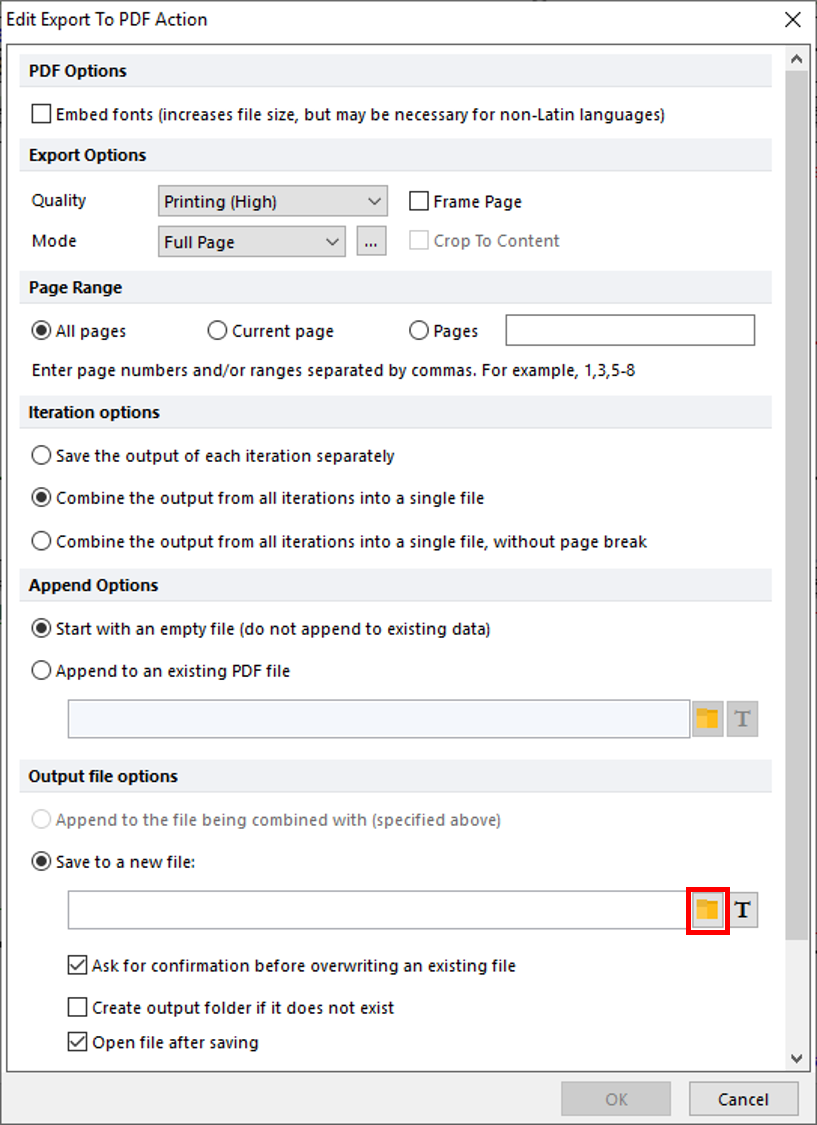
Figure T30.77 Editing the PDF Export Saving Path
52. In the Save As dialog, select your desktop and enter "MyBatchReport" in the File name field.
53. Click Save and the path will appear in the once-empty Save to a new file: field under Output file options.
54. Click OK.
55. Double-click the Excel (Column Mode) in the Batch Actions window.
The Excel (Column Mode) Options dialog will appear (Figure T30.78).
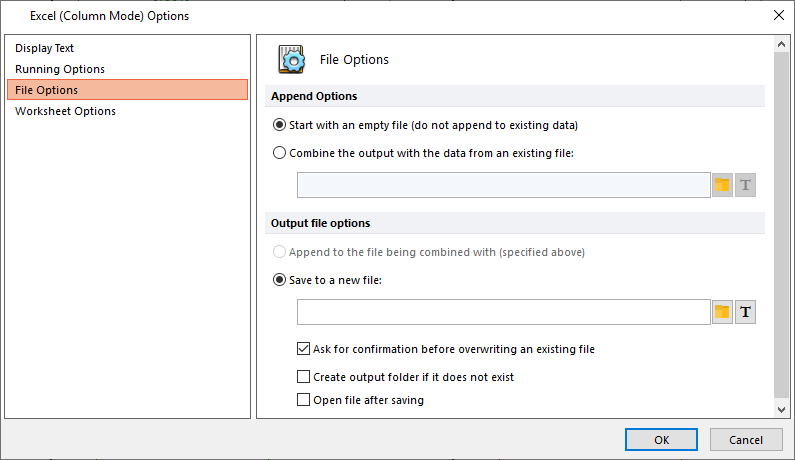
Figure T30.78 Editing the Excel Export Saving Path
56. Repeat steps 51 through 54.
Section 3: Running the Batch and Reviewing Reports
57. Click the Batch tab→Batch Processing group→Options command.
The Batch Processing Options dialog will appear (Figure T30.79).
Notice you have many options when configuring a batch process. Do not change any of the settings already configured. However, notice that we have selected the check box to Unconditionally pause between iterations. This way we do not need to run all wells to test a batch run. In this case, we have only 12 wells and will allow the batch to run completely without pausing. While pausing between iterations is a great way to test a batch run through several steps without committing to a complete run, it will be ignored in this example. For a comprehensive view of all the options, please refer to the Batch Processing Options manual.
58. Uncheck the box for Unconditionally pause between iterations (Figure T30.79, red outline).
59. Click OK.
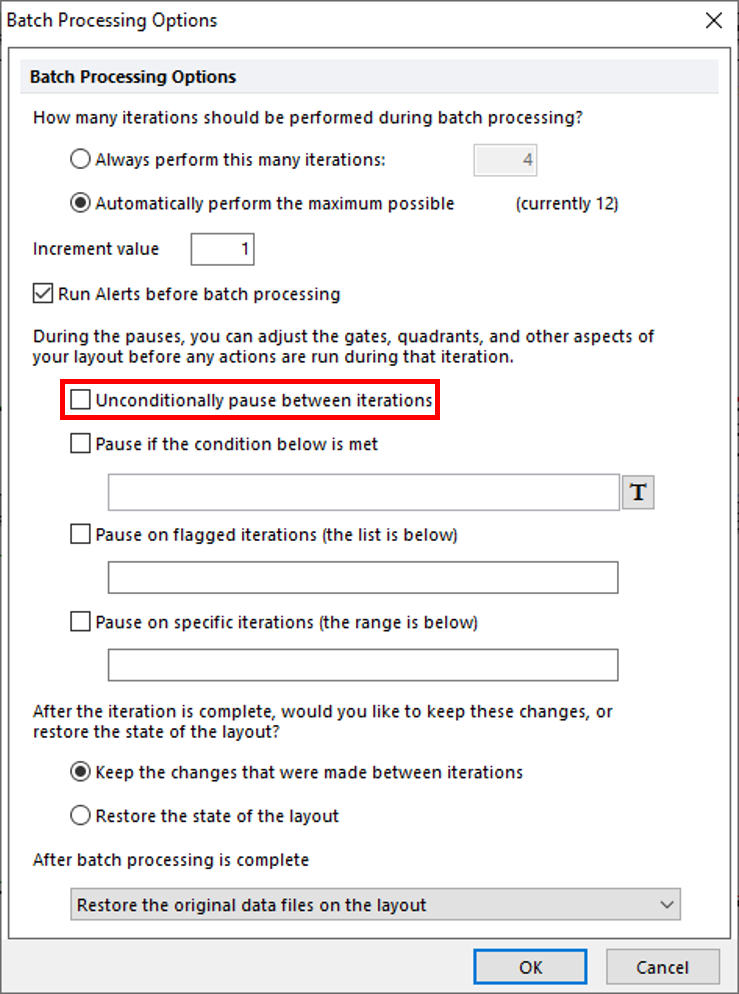
Figure T30.79 Configuring Batch Processing Options
60. Click on Batch tab→Batch Processing group→Run command.
The batch process should complete in under one minute. A status window will appear during the batch process showing how the progress (Figure T30.80).
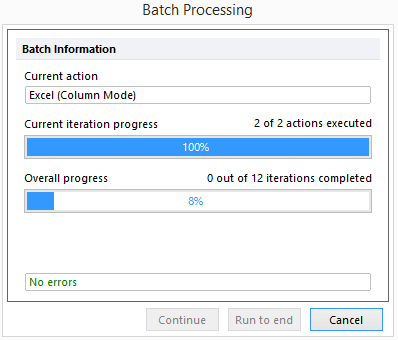
Figure T30.80 Batch Processing Status Window
When finished a PDF file called MyBatchReport.pdf will open automatically with the report. Similarly, an Excel file called MyBatchReport.xls will open.
61. Review the PDF document and confirm there are 12 pages of data, one for each well processed (Figure T28.81)
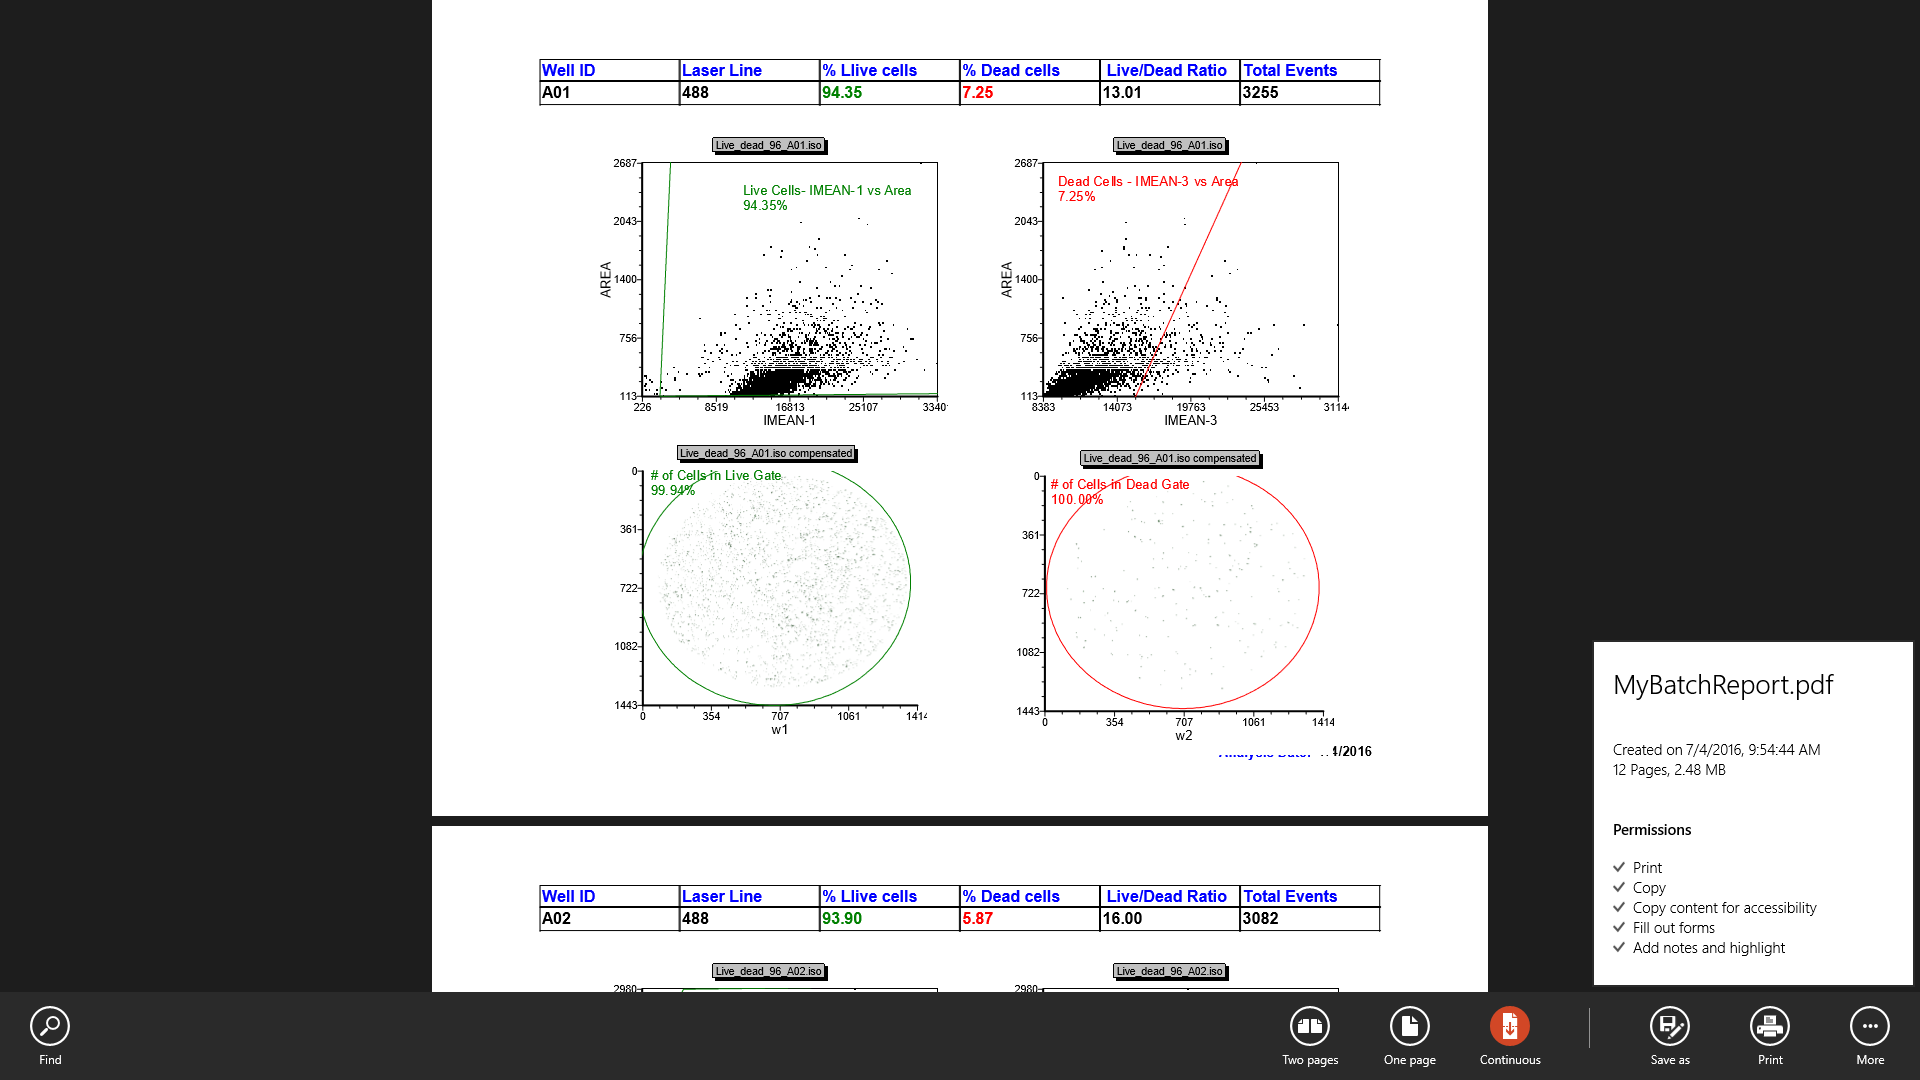
Figure T30.81 "MyBatchReport" PDF Report from Batch Actions
62. Review the Excel spreadsheet; it will have 12 rows of data set exported with the designated column labels. Notice the "Total Events" custom column title is displayed in the header cell G1 (Figure T30.82, red outline).
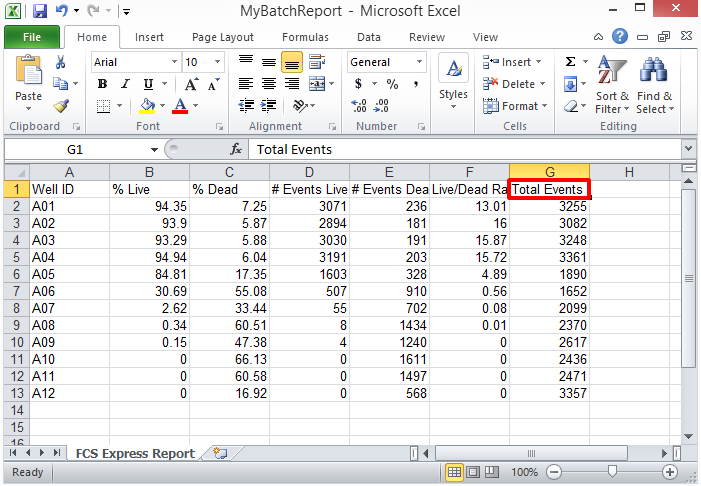
Figure T30.82 "MyBatchReport" Excel Spread Sheet Report from Batch Actions
63. Close the PDF and Excel files. You do not need to save the reports.
64. Return to FCS Express and close the Batch Actions window.
Section 4: Exporting a high-resolution picture from FCS Express
You can save any layout page or plot as a high-resolution image or publication figure.
65. Select the Live Cells Live_dead_96_A01.iso picture plot as shown in Figure T30.83.
Note the picture plot will have a green border if you click inside to select it. It will have a red border if you click the edge of the plot or click the green border. Either state of selection is fine for exporting an image.
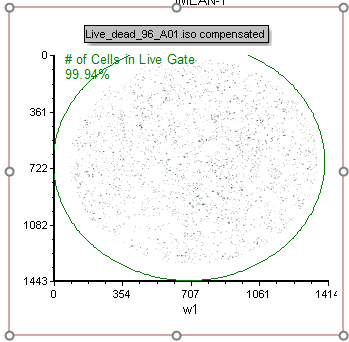
Figure T30.83 "Live_dead_96_A01.iso compensated" Picture Plot
66. Right-click the green or red border of the plot and choose Save selection As Picture (Figure T30.84)
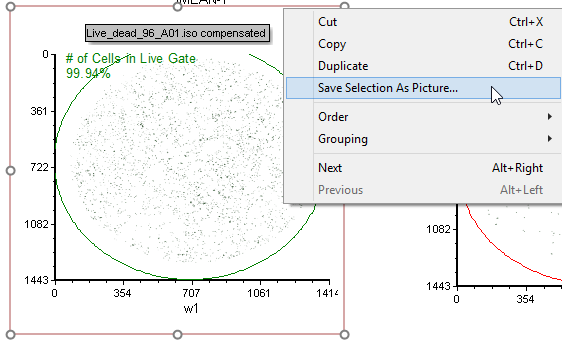
Figure T28.84 Saving a Selected Plot as a Picture
67. Select the Desktop as a destination and enter "MyExportedImage" in the File name: field of the Save Selection as Picture dialog.
65. Select TIF (*.tif) format from the Save as type: field of the Save Selection as Picture dialog.
66. Click Save.
67. Review the .tiff image on your Desktop. Notice it is a high resolution image. You can change the default resolution in the FCS Express User Options.
68. Close the layout without saving changes.
This concludes the Introduction to Image Cytometry tutorial.
