Batch Processing Snapshots
In this tutorial:
•We will learn how to analyze data and take Snapshots through Batch Processing.
•We will learn how to Run and Review the analysis during batch processing.
oRun - will run batch processing and perform all batch actions that are selected for each iteration. Snapshots for each iteration will be recorded automatically but will be applied only if the Apply iteration Snapshots button is pressed.
oReview - will rerun the previous batch process without performing any batch actions. Snapshots for each iteration will be recorded automatically but will be applied only if the Apply iteration Snapshots button is pressed.
•We will learn how to use Batch Processing Options to play back the snapshots taken during analysis.
•We will learn how to Flag an iteration for further review after batch processing has been completed.
•The layout used in this tutorial contains a batch action to Save to PowerPoint. This course assumes that the user knows how to create Batch Processing Actions to be performed each iteration of data.
To Run Batch Processing and Automatically Save Snapshots
1. Navigate to the Tutorial Sample Data folder from the File tab→Open.
2. Open the layout BPSnapshots.fey.
The layout contains 3 iterations of data already in the Data List. The layout also contains a Save to PowerPoint batch action that is designated to save to the Desktop of the Current Windows User. For this tutorial, we will focus on how to set up the Batch Processing Options in order to optimize gates per sample (or iteration) during the batch process.
3. Click on the Batch & Export tab→Batch Export to PDF, PowerPoint, Excel, Prism, ... group→Options command  .
.
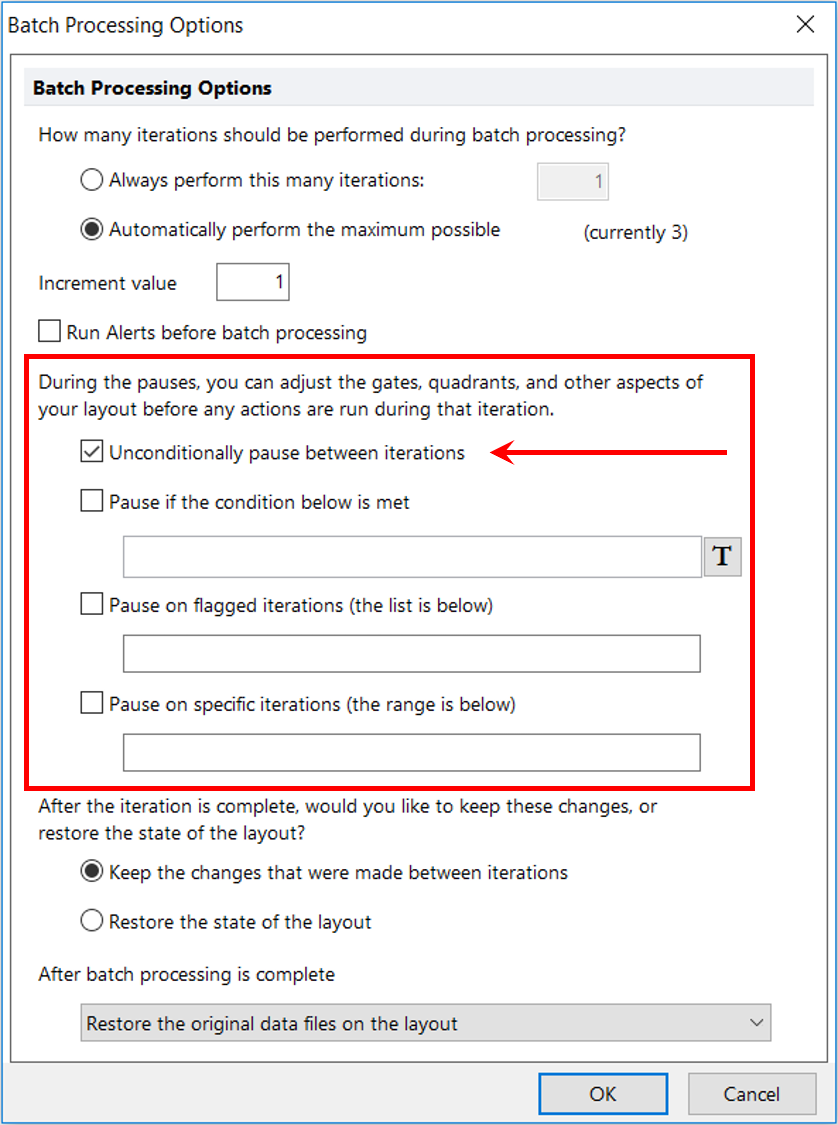
In the Batch Processing Options window, there are several pause options that can be enabled to determine at which iteration(s) FCS Express will pause during batch processing.
4. Select Unconditionally pause between iterations (Figure T9.15).
5. Click OK.

Figure T9.15 Batch Processing Options - Unconditionally Pause Between Iterations Enabled
6. From the Batch tab→Batch Processing group, click the Run button.
The Batch Processing window will appear showing the status of the current action, current iteration progress, and overall progress.
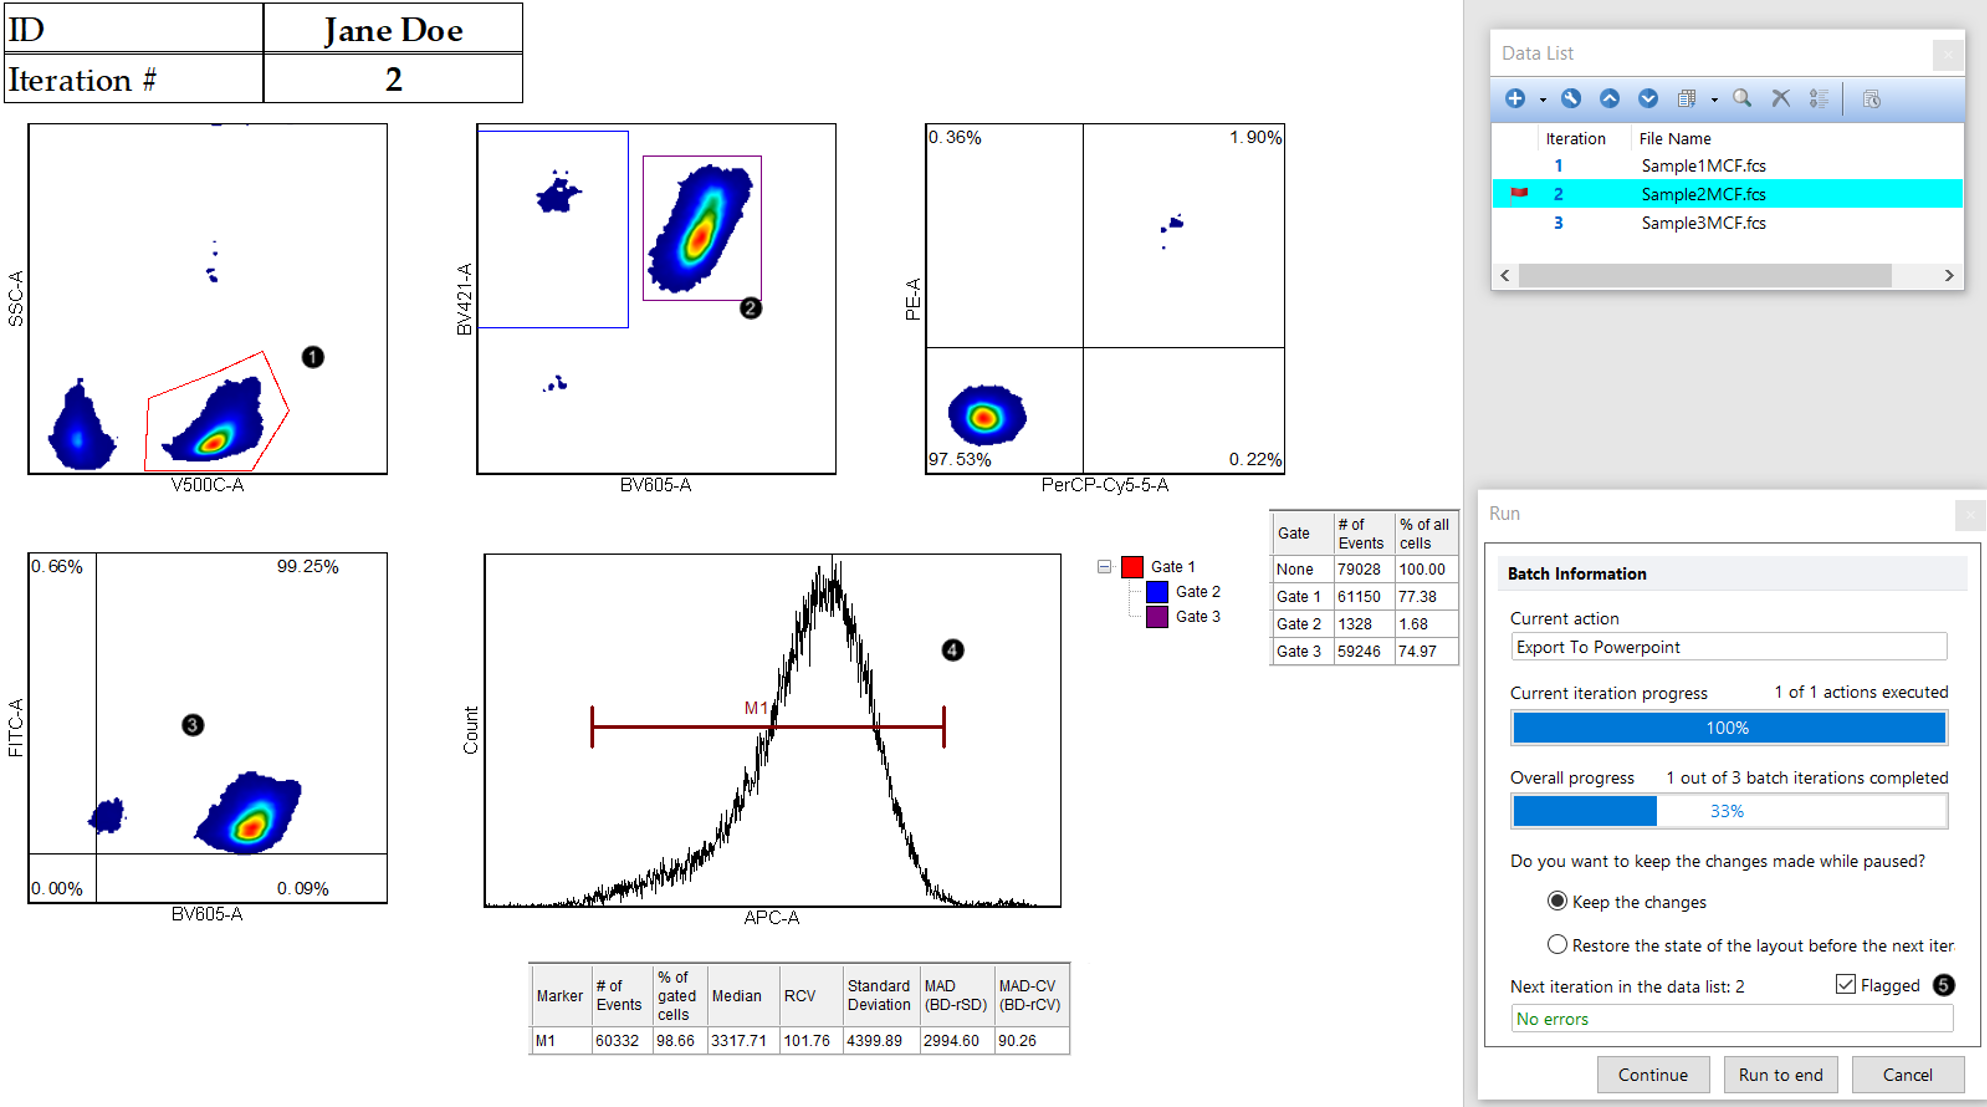
At the first pause, make the following adjustments for Iteration 2 (Figure T9.17):
7. Adjust the Red gate around the cluster of cells in the SSC vs V500 plot. (Figure T9.17, ![]() ).
).
8. Adjust the Purple gate around the cluster of cells on the right side of the BV421 vs BV605 plot. (Figure T9.17, ![]() ).
).
9. Add a Quadrant to the FITC vs BV605 plot (Figure T9.17, ![]() ).
).
10. Adjust the Marker around the peak in the APC 1D histogram (Figure T9.17, ![]() ).
).
11. Click on the Flag icon in the Batch Processing progress window (Figure T9.17, ![]() ).
).

Figure T9.17 Steps for Analysis of Iteration 2
12. In the Batch Processing progress window, click Continue (Figure T9.18).

Figure T9.18 Continuing with Batch Processing
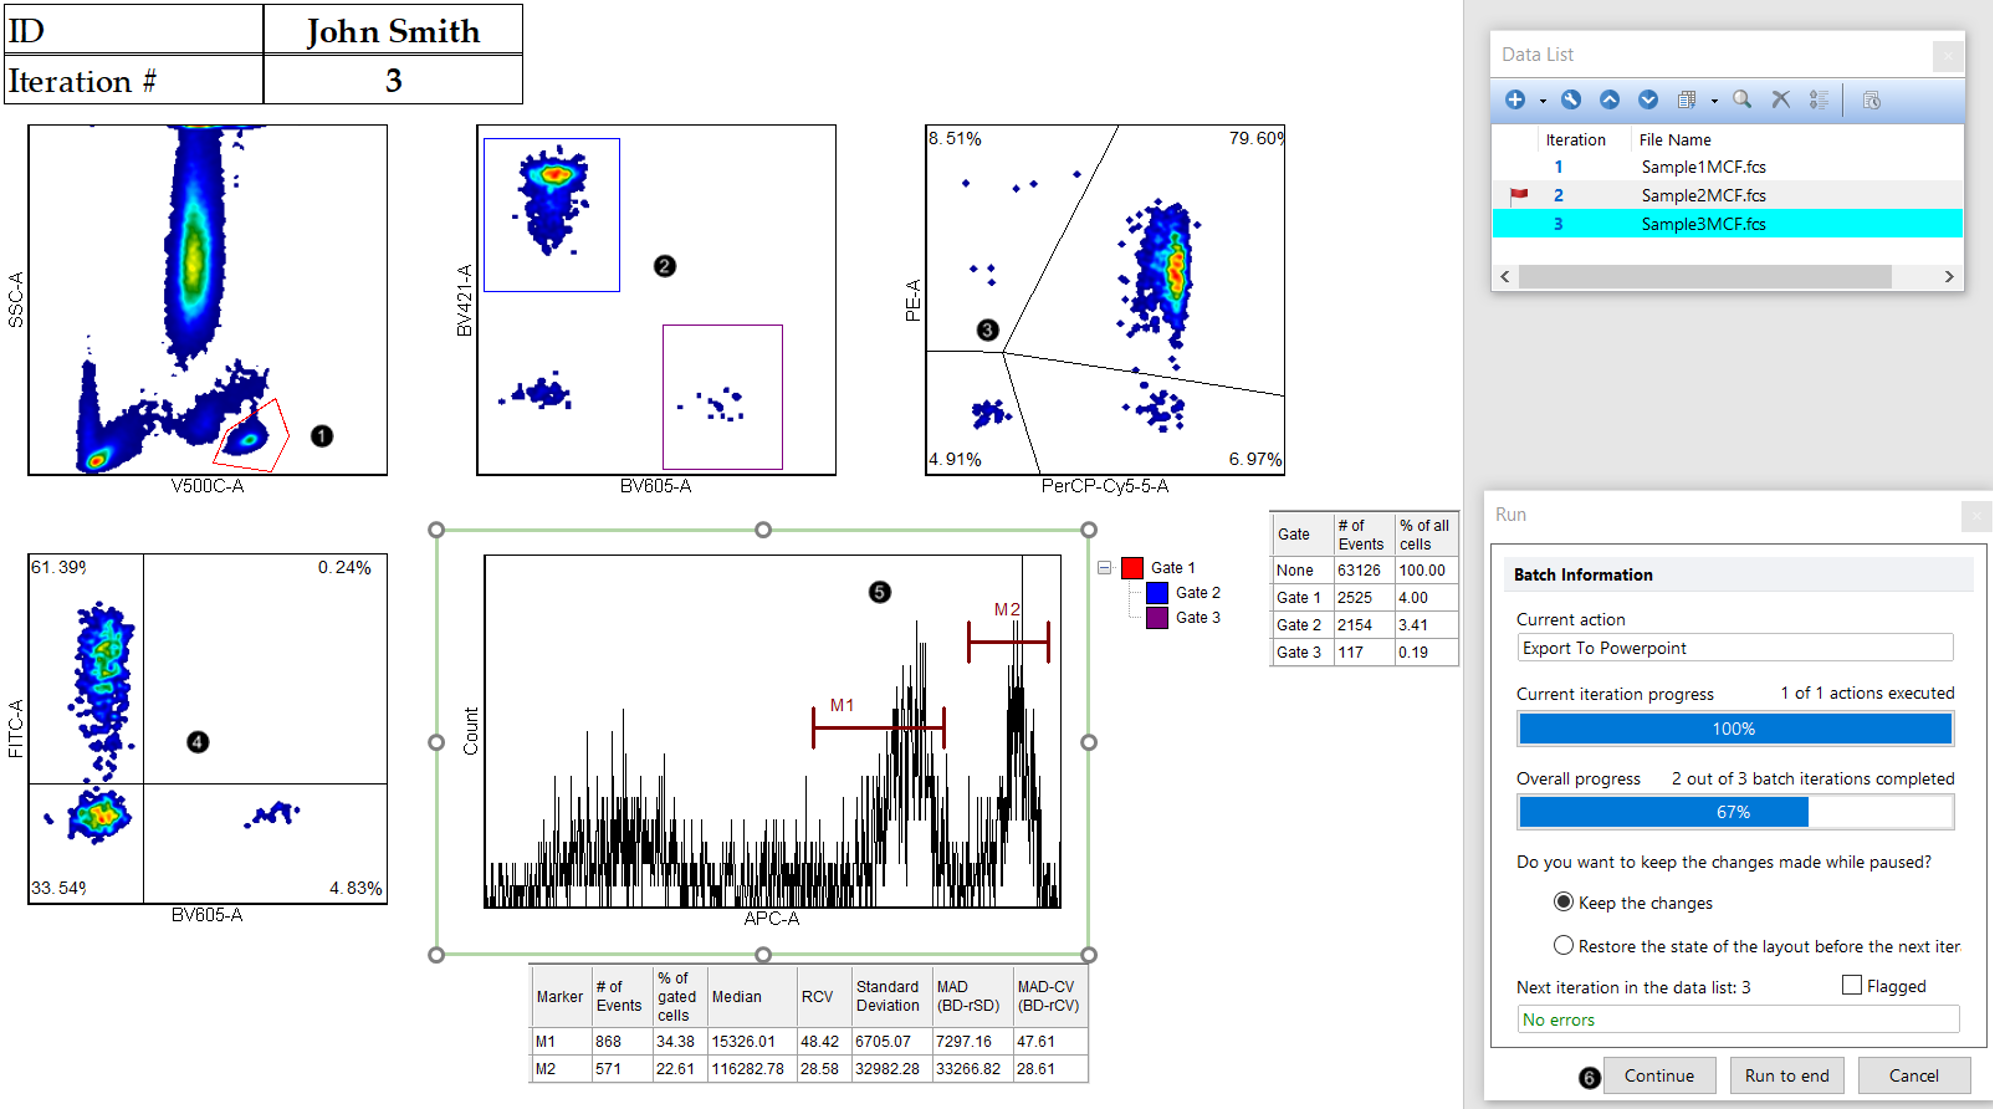
At the second pause, make the following adjustments for Iteration 3 (Figure T9.19):
13. Aadjust the Red gate around the cluster of cells in the SSC vs V500 plot (Figure T9.19, ![]() ).
).
14. Adjust the Blue gate around the cluster of cells in the upper left portion, and the Purple gate around the cluster of cells in the lower right portion of the BV421 vs BV605 plot (Figure T9.19, ![]() ).
).
15. Adjust the floating quadrant as seen in figure 5 in the PE vs PerCP Cy5.5 plot (Figure T9.19, ![]() ).
).
16. Adjust the quadrant as seen in the image in the FITC vs BV605 plot (Figure T9.19, ![]() ).
).
17. Adjust marker M1 around one peak and create a new marker, M2, around the 2nd peak in the APC 1D histogram (Figure T9.19, ![]() ).
).
18. Click Continue within the Batch Processing progress window. At the conclusion of the batch process, the PowerPoint export will open (Figure T9.19 ![]() ).
).

Figure T9.19 Steps for Analysis of Iteration 3
FCS Express has automatically taken Snapshots of each iteration analysis.
To view the Snapshots that were taken, you must press the Batch & Export tab→Snapshots category→Apply Iteration Snapshot button  .
.
Once this button is pressed, Snapshots will be automatically applied:
•when switching from iteration to iteration by clicking on an Iteration number in the Data List.
•when using the Next/Previous buttons to change data on all plots.
•while using Run (see above) and Review (see below) Batch Processing functionalities.
Review will give the user the opportunity to look at their data and make any necessary changes to gate, marker or quadrant positions for each iteration. However, FCS Express will not perform any batch processing actions that were set up when in review mode.
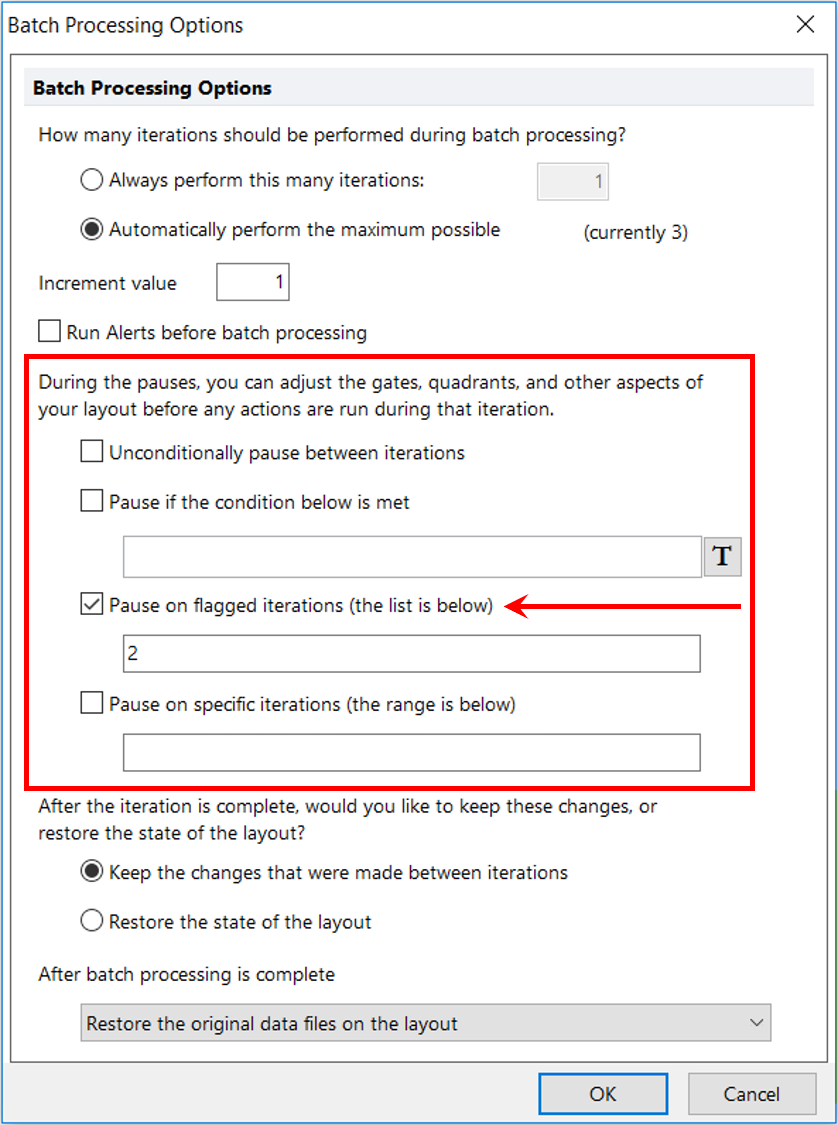
As before, the user can control when FCS Express pauses during batch processing. For the earlier exercise, we chose the option to have FCS Express unconditionally pause between each iteration. This time, we will tell FCS Express that we only want to review any iterations that were flagged during analysis. In this exercise, we flagged the 2nd iteration, so FCS Express will pause only for that iteration.
1. From Batch & Export tab→Batch Export to PDF, PowerPoint, Excel, Prism, ... group, click the Options button.
2. Deselect Unconditionally pause between iterations (if selected).
3. Select the option to Pause on flagged iterations (the list is below) (Figure T9.21).
FCS Express will automatically add any iterations that were flagged by the user during batch processing. In our example, you should the number 2 listed for that pause option.

Figure T9.21 Pause on Flagged Iterations
We now will review the data and the snapshots that were taken at the time of analysis without completing any of the batch actions through the Review command.
4.If you didn't do it yet, press the Batch & Export tab→Snapshots category→Apply Iteration Snapshot button  .
.
5.From Batch & Export tab→Batch Export to PDF, PowerPoint, Excel, Prism, ... group, click the Review button  .
.
6. Once the Review process begins, another Batch Processing progress window will appear.
7. Make any changes that you would like to make. Click Continue or Run to end to complete the process.
