Custom Token Formula Reference

Contents
The following tables are a reference of all operators and functions available for creating custom tokens in the Custom Token Editor and with Parameter Math.
Note about regional settings
Array lists (i.e. lists of values within [ ]) require comma as list separator in US settings (dot as decimal separator) and semicolon with EU settings (i.e. comma as decimal separator). E.g.:
US settings (dot as decimal separator) |
EU settings (comma as decimal separator) |
=Mean([TOKEN1,TOKEN2]) |
=Mean([TOKEN1;TOKEN2]) |
=Minimum([TOKEN1,TOKEN2]) |
=Minimum([TOKEN1;TOKEN2]) |
=Maximum([TOKEN1,TOKEN2]) |
=Maximum([TOKEN1;TOKEN2]) |
Non-array lists (i.e. lists of values that are not within [ ]) use comma as list separator in both regions (EU and US). E.g.:
US settings (dot as decimal separator) |
EU settings (comma as decimal separator) |
=Min(TOKEN1,TOKEN2) |
=Min(TOKEN1,TOKEN2) |
=Max(TOKEN1,TOKEN2) |
=Max(TOKEN1,TOKEN2) |
Note: when using array lists, please note that the list separator does not automatically updated when a layout is opened on a computer using difference regional settings. E.g. if a layout is created using US settings and thus comma as list separator, when the layout will be opened on a computer using EU settings, the list separator will still be comma and will have to be manually replaced by a semicolon to make the toke being evaluated properly.
----------------------------
Operator |
Description |
|---|---|
x+y |
Add x and y |
x-y |
Subtract y from x |
x*y |
Multiply x and y |
x/y |
Divide x by y |
x^y |
x to the y power |
Conditional/Comparison Operators. Use these with IF..THEN..ELSE statements.
Operator |
Description |
|---|---|
x>y |
x is greater than y |
x<y |
x is less than y |
x=y |
x is equal to y |
x>=y |
x is greater than or equal to y |
x<=y |
x is less than or equal to y |
x<>y |
x is not equal to y |
Logical Operators. These are used in IF..THEN..ELSE statements or to combine two equations.
Operator |
Description |
|---|---|
x OR y |
x OR y |
x AND y |
x AND y |
NOT (x AND y) |
Inverse of the value of (x AND y) |
Example: if (x>20 and y>20) then......else If combining multiple logical operators, parenthesis must surround each operator. Example: if ((x>20 and y>20) and (a<1 or b>10)) then......else |
|
Function |
Description |
|---|---|
Abs(x) |
Absolute value of x |
ArcCos(x) |
Arc Cosine of x |
ArcCosh(x) |
Hyperbolic Arc Cosine of x |
ArcSin(x) |
Arcsine of x |
ArcSinh(x) |
Hyperbolic Arcsine of x |
ArcTan(x) |
Arctangent of x |
ArcTanh(x) |
Hyperbolic Arctangent of x |
ConvertLinToLog(I,J,K,L) |
Converts a linearly scaled value into a logarithmically scaled value, using the following parameters: I = Lin value, J = # of decades, K = output range (with values of 0, 256, 512, or 1024), L = offset
This will convert a value from 1-10,000 to 0-1024.
This function can also be used in the Parameter Math tool to convert an entire parameter. The parameter to convert should be specified as the I term using the Pn notation (e.g. P1, P2, P3,....). |
ConvertLogToLin(I,J,K,L) |
Converts a Logarithmically scaled value into a Linearly scaled value, using the following parameters: I = Log value, J = # of decades, K = input range, L = offset
This will convert a value from 0-1024 to 1-10,000.
This function can also be used in the Parameter Math tool to convert an entire parameter. The parameter to convert should be specified as the I term using the Pn notation (e.g. P1, P2, P3,....). |
Cos(x) |
Cosine of x |
Cosh(x) |
Hyperbolic Cosine of x |
CoTan(x) |
Cotangent of x |
Ln(x) |
Natural logarithm of x |
Log(x,y) |
Logarithm of y in base x |
Max(x,y) |
Returns the higher value of x and y. |
Maximum([x,y,z...]) |
Returns the maximum value in the array ([x,y,z,…]). The array can hold an unlimited number of elements. |
Mean([x,y,z...]) |
Returns the mean of the values in the array [x,y,z,…]. The array can hold an unlimited number of elements. |
Min(x,y) |
Returns the lower value of x and y. |
Minimum([x,y,z...]) |
Returns the minimum value in the array ([x,y,z,…]). The array can hold an unlimited number of elements. |
Range([x,y,z...]) |
Returns the result of (Maximum([x,y,z,…]) – Minimum([x,y,z,…])). |
Sin(x) |
Sine of x |
Sinh(x) |
Hyperbolic Sine of x |
Sqr(x) |
x squared |
Sqrt(x) |
Square root of x |
StdDev([x,y,z...]) |
Returns the standard deviation of the values in the array [x,y,z,…]. The array can hold an unlimited number of elements. |
Tan(x) |
Tangent of x |
Type Conversion Functions. These are used in more advanced formulas, to convert a number to text and vice versa. They are used when the value returned by a particular token is not the type that you need, and you want to convert it to a type that you can include in your formula. You could also change the result type as described in Custom Token Formatting.
Function |
Description |
|---|---|
NumericToString(number) |
Converts number to a text string. |
StringToNumeric("text") |
Converts the text to a number. |
Logic (True/False) Functions. These functions evaluate whether the condition defined by the variables is True or False. Some of the functions return a numerical representation of True (-1) or of False (0).
Function |
Description |
|---|---|
Between(number1,number2,number3) |
Returns True if number1 is between number2 and number3 (including being equal to number2 or number3). Otherwise, this function will return False or the numerical equivalent, 0. |
FalseValue |
Returns 0. |
IsFalse(number) |
Returns True if number has a value of 0.
Typically, number will represent a condition, such as x>y. The Conditional/Comparison operators listed above can be used in this context. |
IsSameText([Text1,Text2,TextN],CaseSensitive) |
The IsSameText function can be used in a situation where text values need to be evaluated to see whether or not they match.
For example, this function can be used to evaluate whether a sample identification keyword between multiple tubes within the same panel is identical or not.
This function returns True (or -1.0) if each text value in the sequence are the same or False (0.0) if the text values are not the same. CaseSensitive is set to either True or False. Please note the brackets before the first text value and after the last text value. Each text value within the brackets is separated by a comma.
If CaseSensitive is True, the words must match in case, in addition to its content.
Please note that the output from this function will be either a -1.0 or 0.0.
If the user is looking for a text output for the condition being evaluated using this function, an IF THEN ELSE statement will need to be created separately that evaluates the output from the IsSameText function. |
IsTrue(number) |
Returns True if number has a value of -1.
Typically, number will represent a condition, such as x>y. The Conditional/Comparison operators listed above can be used in this context. |
RegExMatch("Text","Regular Expression") |
The function RegExMatch uses a regular expression (a specific, standard textual syntax for representing patterns for matching text) that can be executed and matched against a string representing the text being searched in. Please see: https://en.wikipedia.org/wiki/Regular_expression for more information on regular expressions in general. |
StartsWith("text1", "text2", CaseSensitive) |
The function StartsWith evaluates whether “text1” starts with “text2”.
For Example: StartsWith(“Friend”, “Fri”, True) gives a result of -1.00 if it is True and 0.00 if False. |
TrueValue |
Returns -1. |
Text Manipulation Functions. These functions can be used to manipulate or get information out of existing text values.
Function |
Description |
||||||||||||||||
|---|---|---|---|---|---|---|---|---|---|---|---|---|---|---|---|---|---|
AreValuesInRange([number1,number2,...],tolerance,[name,1,name2,name3...]) |
This function will determine if the numbers in [number1,number2,...] are within a percentage of each other, as determined by tolerance.
If the values in the array [number1,number2,...] are all within tolerance % of each other, the function returns True.
If a pair of values in the array are not within tolerance % of each other, the function returns text indicating which ones are not.
For example: =AreValuesInRange([100,105],10,["Sample 1","Sample 2"]) will return True since all 3 values are within the tolerance of 10%.
=AreValuesInRange([100,120],10,["Sample 1","Sample 2"]) will return Sample 1 is not within 10% of Sample 2.
Please note that the number of number entries and name entries must match.
In other words, there are 3 numbers involved in the numerical evaluation of the function, there must be 3 corresponding name entries. If these do not match, the function will return The number of elements in values array and names array is not the same. |
||||||||||||||||
ChangeExtension("file_path", "new_extension") |
This function accepts a file name and new file extension and will return the text of the file name with the new file extension.
For example: if a file path is C:\Data Files\FlowData1.xyz, ChangeExtension("C:\Data Files\FlowData1.xyz","csv") will return C:\Data Files\FlowData1.csv. |
||||||||||||||||
Copy("text",number1,number2) |
The function Copy will copy a a string of characters from "text", which is the full text, based on the values of number1 and number2.
number1 is the position to start copying text.
number2 is the number of characters to copy from the full text.
For example: COPY("SheldonCooper",1,7) will return Sheldon because the function will start at the first character of the string, denoted by number1, and copy the characters denoted by number2, including the character denoted by number1.
Please note that number1 can also be derived from a token or custom token.
If the position to start copying text is based on the position of a character, such as a delimiter, the pos("text1","text2") function can be used to determine number1.
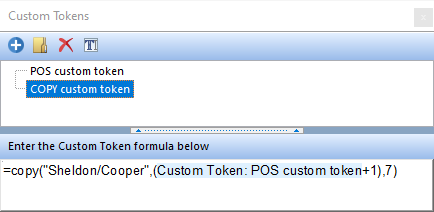
For example, in the image below:
This COPY function is using the value established from a POS function to determine where to start the copy within the text string Sheldon/Cooper.
The POS function is determining the position of the / within the text string Sheldon/Cooper. In this function, the output will be a value of 8, since the / is the 8th character within the sting.
A +1 is added after the POS custom token to indicate that the copy will not include the character /.
The output of this overall custom token will be Cooper since: •the text is Sheldon/Cooper, •the number1, along with +1, is being determined by the POS function, indicating a value of 9 , •and number2 is indicating the number of characters to copy after number1. |
||||||||||||||||
ExtractFilename("file_path") |
This function will evaluate a file name and return the text of the data file name.
For example: if a file path is C:\Data Files\Today\FlowData1.fcs, ExtractFilename("file_path")will return FlowData1.fcs.
Keyword tokens using the keywords $FIL, $FCSE_FILENAME or $FCSE_FILENAMENOPATH can be used for this function. |
||||||||||||||||
ExtractFolderFromFilename("file_path") |
This function will evaluate a file name and return the text of the file path of the folder in which the data is contained.
For example: if a file path is C:\Data Files\Today\FlowData1.fcs, ExtractFolderFromFilename("file_path") will return C:\Data Files\Today.
Keyword tokens using the keyword $FCSE_FILENAME can be used for this function. |
||||||||||||||||
FileExists(file_path) |
This function will evaluate if a file exists at a particular file path.
For example: If a file path is C:\Data Files\Today\FlowData1.fcs, FileExists($FCSE_FILENAME) will return -1.00 if the file exists and 0.00 if the file does not exist.
If evaluating a manually entered pathway use quotations marks as shown here =FileExists("C:\Users\Desktop\Data\Control.fcs")
Keyword token $FCSE_FILENAME may be used for this function. |
||||||||||||||||
FolderExists(folder_path) |
This function will evaluate if a folder exists at a particular file path.
For example: If evaluating the system token "Desktop Folder" in FolderExists(Desktop Folder) the function will return -1.00 if the folder exists and 0.00 if the folder does not exist.
If evaluating a manually entered pathway use quotations marks as shown here =FolderExists("C:\Users\Desktop\Data") |
||||||||||||||||
FormatFloat("format string",number) |
FormatFloat formats the floating-point value given by Number using the format string given by Format String. The following format specifiers are supported in the format string:
The number being formatted is always rounded to as many decimal places as there are digit placeholders ('0' or '#') to the right of the decimal point. If the format string contains no decimal point, the value being formatted is rounded to the nearest whole number. If the number being formatted has more digits to the left of the decimal separator than there are digit placeholders to the left of the '.' character in the format string, the extra digits are output before the first digit placeholder. To allow different formats for positive, negative, and zero values, the format string can contain between one and three sections separated by semicolons, as follows: *One section: The format string applies to all values. *Two sections: The first section applies to positive values and zeros, and the second section applies to negative values. *Three sections: The first section applies to positive values, the second applies to negative values, and the third applies to zeros. If the section for negative values or the section for zero values is empty, that is if there is nothing between the semicolons that delimit the section, the section for positive values is used instead. If the section for positive values is empty or if the entire format string is empty, the value is formatted using general floating-point formatting with 15 significant digits. General floating-point formatting is also used if the value has more than 18 digits to the left of the decimal point and the format string does not specify scientific notation. |
||||||||||||||||
FragmentCount("text1",'text2") |
This function returns the number of string fragments in text2 separated by text1.
Text1 will equal a delimiter, such as "\", for example. Text2 will be a pathway.
For example: FragmentCount("\","C:\Documents\Data\Sample.fcs") will return 4, since there are 4 fragments that are delimited by "\".
Keywords that return a pathway, such as $FCSE_FILENAME, can be used for Text2. |
||||||||||||||||
GetContainingFolder("file_path") |
Returns the name of the folder containing the file named in file_path.
Example, if file Sample.fcs was located in the directory C:\Program Files\De Novo Software\FCS Express 7 Plus Research Edition/Data, the output for this function would be Data. |
||||||||||||||||
GetFragment(n, "text1", "text2") |
Returns the Nth string fragment in text2, delimited by text1.
N = the nth occurrence, Text1 = a delimiter, such as "\", Text2 = a string that uses Text1 as a delimiter.
Some examples of Text2 could be: ▪a pathway that uses "\" as a delimiter, such as C:\Documents\Data\Sample.fcs. ▪a name of a file where several identifiers have been concatenated together and delimited by "_", such as FirstnameLastname_ID1_ID2_ID3_Date.
For example, GetFragment(1, "\", "C:\Documents\Data\Sample.fcs") will return C:.
GetFragment(2, "\", "C:\Documents\Data\Sample.fcs") will return Documents.
If n is a positive number, the function will start evaluating the text string from left to right.
If n is a negative number, the function will start evaluating the text string from right to left.
For example, GetFragment(-2,"_","SheldonCooper_ABC_DEF_GHI") will return DEF. |
||||||||||||||||
IncludeTrailingPathDelimiter("file_path") |
Accepts the value of file_path, while including the delimiter (\, for example) at the end of the string. |
||||||||||||||||
pos("text1","text2") |
The pos("text1","text2") function will return the position of text text1 in text string text2.
text1 is the text for which you are searching. text2 is the text in which you are searching for text1.
If text2 cannot be found in text1, the return value is 0.
For example:
pos("/" , "Sheldon/Cooper") will return an 8, since the / is the 8th character within the text string Sheldon/Cooper. pos("/" , "SheldonCooper") will return an 0, since the / is not found within the text string SheldonCooper.
Quotes are not needed around X or Y if X or Y are tokens that have been formatted for a Result Type of Text.
The pos("X","Y") function is a useful function that can be used in tandem with other text manipulation functions, such as Copy("text",number1,number2), where the point at which the copy of text will start is dependent on the position of another character within a text string.
In this scenario, both functions should be created as their custom token, with the custom token for the pos function being used as the variable number1 within the COPY function. |
||||||||||||||||
PositionInText("text1","text2",startingPosition,n) |
PositionInText returns the position of a string within another string. Text1 = the text for which you are searching Text2 = the text in which you are searching startingPosition = the position at which to start searching (1,2,3...etc.) n = the Nth occurrence for the string for which you are searching (1 for 1st occurrence, 2 for 2nd occurrence, etc.)
For example =PositionInText("d","abcdefgabcdefg",1,1) would return 4 because the first occurrence (N=1) of "d" occurs at position 4. =PositionInText("d","abcdefgabcdefg",1,2) would return 11 because the second occurrence (N=2) of "d" occurs at position 11.
This function would return a "0" if no occurrence can be found. |
||||||||||||||||
RemoveExtension("filename") |
|||||||||||||||||
RemoveSpaces("text") |
Removes existing spaces from text and returns the resulting text.
For example: RemoveSpaces("Sheldon Cooper") will return SheldonCooper. |
||||||||||||||||
RemoveText("text1","text2",RemoveAll) |
This function will remove the string text1 from text2. RemoveAll will equal True or False depending on whether only the first occurrence is to be removed. For example, =RemoveText("def","abcdefg",True) will return abcg. |
||||||||||||||||
ReplaceText("text1","text2","text3",RemoveAll) |
This function will replace the string text1 with the string text2 located within the string text3. RemoveAll will equal True or False depending on whether only the first occurrence is to be removed. For example, =ReplaceText("def","xyz","abcdefg",True) will return abcxyzg. |
||||||||||||||||
"text1"+"text2" |
If text1 and text2 are both text strings, this quick equation returns the joining of text1 and text2.
For example: ="Sheldon"+"Cooper" will return SheldonCooper
Note: Token is not represented in the "Insert Function" list since it is an general text based operation. |
||||||||||||||||
Trim("text") |
Trim removes spaces before and after a string of text. For example, =Trim(" abcd efgh ") will return "abcd efgh" |
||||||||||||||||
TrimLeft("text") |
TrimLeft removes spaces to the left of a string of text For example, =TrimLeft(" abcd efgh ") will return "abcd efgh " |
||||||||||||||||
TrimRight("text") |
TrimRight removes spaces to the right of a string of text For example, =TrimLeft(" abcd efgh ") will return " abcd efgh" |
Operator |
Description |
|---|---|
ANOVA([number1,...,numberX|number1,...,numberY|number1,...,numberZ],alpha)
|
Performs a single-factor Analysis of Variance (ANOVA) of data in list form and reports the full set of results. The alpha is the desired significance level; this value must range between 0 and 1.
number1,..., numberX reflect the list of data values for one group number1,..., numberY reflect the list of data values for a second group number1,..., numberZ reflect the list of data values for a third group
The P-value is reported when using this function.
Please also see the ANOVA chapter of the manual for more details on additional implementations of ANOVA via spreadsheets. |
ChiSquareTest([number1,...],[number2,...]) |
Performs the Chi-squared goodness of fit test to test if data is coming from specific distribution. The first parameter is an array of observed frequencies, the second parameter is an array of estimated (theoretical) frequencies.
This function returns the probability of observing the given result by chance given that the null hypothesis is true, where the null hypothesis is that the distribution in the first array is the same as the distribution in the second array.
The FCS Express implementation of this function is a right tailed test. |
FTest([number1,...],[number2,...]) |
Performs F-Test by comparing number1 and number2 standard deviations. The parameters are the first and the second data set. |
GrubbsTest([number1,...]) |
Performs the Grubbs test for outliers. Test is used to detect outliers in a univariate data set. It is based on the assumption of normality. That is, you should first verify that your data can be reasonably approximated by a normal distribution before applying the Grubbs' test. The parameter is the data set. |
KSTest([number1,...],[number2,...]) |
Performs two-sample Kolmogorov-Smirnov goodness of fit test of independent random samples Data1 and Data2. Test determines if Data1 and Data2 samples are drawn from the same continuous population. The parameters are the first and the second data set. |
KSTest2([number1,...],[number1,...], tails, significance) |
Performs two-sample Kolmogorov-Smirnov goodness of fit test of independent random samples Data1 and Data2. Test determines if Data1 and Data2 samples are drawn from the same continuous population. The parameters are the first and the second data set, the hypothesis type ("TWO_TAILED", "LEFT_TAILED" or "RIGHT_TAILED" (not case sensitive and requires quotes)), and significant level for which to test. For example, 0.05. |
LillieforsTest([number1,...]) |
Performs the Lilliefors goodness of fit test on array1 to determine if the data follows a normal distribution with unspecified mean and unspecified standard deviation. Returns the p-value using a significance level of 0.05. A minimum of 4 values must be provided. Should not be applied to samples with more than 500 data points. |
MannWhitney([number1,...],[number1,...],hypothesis type,alpha, use normal approximation) |
The Mann Whitney test is a nonparametric test of the null hypothesis that two samples come from populations of equal means, against an alternative hypothesis, especially that a particular population has a larger mean than the other one. It operates under the assumption that all the observations from both groups are independent of each other. (Credit: Wikipedia)
The variables for the functions are as follows:
[Number1.....] - Comma separated values from the 1st data set. [Number2.....] - comma separated values from the 2nd data set. Hypothesis Type - TWO_TAILED, LEFT_TAILED or RIGHT_TAILED (not case sensitive) Alpha - the significance level for which to test. For example, 0.05. Use Normal Approximation - True/False |
PercentilePlot(Plot Number, Axis, Overlay Number, k-th Percentile) |
Returns the k-th percentile of the distribution displayed in a plot. Plot Number - Must be an integer value greater than, or equal to, 1. Axis - Must be a text string (in quotes) between “X”, “X axis”, “XAxis”, “Y”, “Y axis”, or “YAxis”. Overlay Number - Must be an integer value greater than, or equal to, 1. Percentile - Is the percentile (inclusive) of interest. Decimals are allowed when setting the statistic to a specific percentile. |
SSMD(mean max,mean min,n max,n min,SDmax,SDmin) |
Short for Strictly Standardized Mean Difference. Has been used as a ranking metric for hit selection in high throughput screening assays. |
StainIndex(positive population mean/median, negative population mean/median, negative population standard deviation). |
Performs a stain index calculation using the means/medians of positive and negative populations and the negative population standard deviation based on the Stain Index formula of (Median of Positive - Median of Negative) / (SD of Negative * 2). |
TTest1S([number1,...],expected mean) |
Performs the one sample T-test. It compares Data mean value with the expected mean. The first parameter is the data set. |
TTest2S([number1,...],[number2,...],tails,paired) |
It compares Number1 mean value with Number2 mean value. The assumption is Number1 and Number2 variances are equal, but unknown. The first 2 parameters are the first and the second data sets. Tails parameter can be 1 or 2. It is used to define the type of null hypothesis, a value of 1 means left tailed, a value of 2 means two tailed. Paired can be True or False. If True, it will perform Two-Sample Paired t-Test. If False, it will perform Two-Sample Pooled (unpaired) t-Test. |
Wilcoxon([number1,...],[number1,...],hypothesis type,alpha) |
The Wilcoxon test is a nonparametric test that compares two paired groups. The test calculates the difference between each set of pairs and analyzes these differences. The Wilcoxon Rank Sum test can be used to test the null hypothesis that two populations have the same continuous distribution. (credit: Investopedia)
The variables for the functions are as follows:
[Number1.....] - Comma separated values from the 1st data set. [Number2.....] - comma separated values from the 2nd data set. Hypothesis Type - TWO_TAILED, LEFT_TAILED or RIGHT_TAILED (not case sensitive) Alpha - the significance level for which to test, for example, 0.05. |
ZPrime(mean negative,SD negative,mean positive,SD positive) |
The ZPrime function is used to calculate the Z Factor. The Z-factor is an attempt to quantify the suitability of a particular assay for use in a full-scale, high-throughput screen by comparing the Mean and Standard Deviation of a negative control to the Mean and Standard Deviation of a positive control within the experiment. |
ZTest([number1,...],expected mean,expected SD) |
Compares the normally distributed Data elements mean value with known standard deviation expected SD, to a mean value expected mean. ([Number1,...]) is the data set. |
Date and Time Manipulation Functions
Function |
Description |
|---|---|
DateKWToDate($DATE keyword,n) |
Takes the standardized format of the $DATE keyword, which is in either dd-mmm-yy or dd-mmm-yyyy format, and returns mm/dd/yyyy.
If $DATE has the year listed as yy, n will be placed in front of yy to produce yyyy. A keyword token will be used to insert the value of $DATE.
For example if the $DATE keyword equals 03-Nov-05, DateKWToDate($DATE,20) will return 11/03/2005.
If the year is already formatted as yyyy, the function will still return mm/dd/yyyy. If the year is already formatted as yyyy, n must still be accounted for in the function.
For example, if $DATE keyword equals 04-Jul-2008, DateKWToDate($DATE,20) will return 07/04/2008. Also, DateKWToDate($DATE,0) will return 07/04/2008. |
DateTimeToStrFMT(time, format)
|
DateTimeToStrFMT formats the Time or Date value given by using the format desired.
Example: =DateTimeToStrFMT(Current Date token, "yyyy-mm-dd") will return the Current Date in a format showing Year-Month-Day, with 2 digits for the month and day, and 4 digits for the year.
=DateTimeToStrFMT(Current Time token,"hh:mm:ss") will return the Current Time in a format showing Hour:Minute:Second, with 2 digits for Hour, Minute and Second.
*Please note that if using the <Current Date> token, no quotation marks are needed, as the Result Type for this token is Text.
Formats can use the Specifier Displays shown below.
|
DaysBetween(StartDate,EndDate) |
Returns the number of days between the values entered for the StartDate and EndDate.
Dates in anything other than a mm/dd/yyyy format will need to be run through DateKWToDate and/or FormatDateTime prior to being used within this function. |
FormatDateTime("format","Date or Time") |
FormatDateTime formats the Time or Date value given by using the format given.
Example: =FormatDateTime("yyyy-mm-dd",(<Current Date token>)) will return the Current Date in a format showing Year-Month-Day, with 2 digits for the month and day, and 4 digits for the year. =FormatDateTime("hh:mm:ss",(<Current Time token>)) will return the Current Time in a format showing Hour:Minute:Second, with 2 digits for Hour, Minute and Second.
*Please note that if using the <Current Date> token, no quotation marks are needed, as the Result Type for this token is Text.
Formats can be as follows below:
c Displays the date using the format given by the ShortDateFormat global variable, followed by the time using the format given by the LongTimeFormat global variable. The time is not displayed if the date-time value indicates midnight precisely. d Displays the day as a number without a leading zero (1-31). dd Displays the day as a number with a leading zero (01-31). ddd Displays the day as an abbreviation (Sun-Sat) using the strings given by the ShortDayNames global variable. dddd Displays the day as a full name (Sunday-Saturday) using the strings given by the LongDayNames global variable. ddddd Displays the date using the format given by the ShortDateFormat global variable. dddddd Displays the date using the format given by the LongDateFormat global variable. e (Windows only) Displays the year in the current period/era as a number without a leading zero (Japanese, Korean, and Taiwanese locales only). ee (Windows only) Displays the year in the current period/era as a number with a leading zero (Japanese, Korean, and Taiwanese locales only). g (Windows only) Displays the period/era as an abbreviation (Japanese and Taiwanese locales only). gg (Windows only) Displays the period/era as a full name (Japanese and Taiwanese locales only). m Displays the month as a number without a leading zero (1-12). If the m specifier immediately follows an h or hh specifier, the minute rather than the month is displayed. mm Displays the month as a number with a leading zero (01-12). If the mm specifier immediately follows an h or hh specifier, the minute rather than the month is displayed. mmm Displays the month as an abbreviation (Jan-Dec) using the strings given by the ShortMonthNames global variable. mmmm Displays the month as a full name (January-December) using the strings given by the LongMonthNames global variable. yy Displays the year as a two-digit number (00-99). yyyy Displays the year as a four-digit number (0000-9999). h Displays the hour without a leading zero (0-23). hh Displays the hour with a leading zero (00-23). Please note that the default display for the hour is in a 24 hour format. m Displays the minute without a leading zero (0-59). mm Displays the minute with a leading zero (00-59). s Displays the second without a leading zero (0-59). ss Displays the second with a leading zero (00-59). z Displays the millisecond without a leading zero (0-999). zzz Displays the millisecond with a leading zero (000-999). t Displays the time using the format given by the ShortTimeFormat global variable. tt Displays the time using the format given by the LongTimeFormat global variable. The variables t or tt are usually used on their own as the format. am/pm Uses the 12-hour clock for the preceding h or hh specifier, and displays 'am' for any hour before noon, and 'pm' for any hour after noon. The am/pm specifier can use lower, upper, or mixed case, and the result is displayed accordingly. a/p Uses the 12-hour clock for the preceding h or hh specifier, and displays 'a' for any hour before noon, and 'p' for any hour after noon. The a/p specifier can use lower, upper, or mixed case, and the result is displayed accordingly. ampm Uses the 12-hour clock for the preceding h or hh specifier, and displays the contents of the TimeAMString global variable for any hour before noon, and the contents of the TimePMString global variable for any hour after noon. / Displays the date separator character given by the DateSeparator global variable. : Displays the time separator character given by the TimeSeparator global variable. 'xx'/"xx" Characters enclosed in single or double quotation marks are displayed as such, and do not affect formatting. |
HoursBetween(start time,end time) |
Counts the number of hours between the start time and the end time.
The keywords $BTIM or $ETIM can be used for the start and end times. However, user-defined times would need to be fed through the StrToTimeFMT function prior to use in this function to establish the proper formatting. |
MillisecondsBetween(start time,end time) |
Counts the number of milliseconds between the start time and the end time.
The keywords $BTIM or $ETIM can be used for the start and end times. However, user-defined times would need to be fed through the StrToTimeFMT function prior to use in this function to establish the proper formatting. |
MinutesBetween(start time,end time) |
Counts the number of minutes between the start time and the end time.
The keywords $BTIM or $ETIM can be used for the start and end times. However, user-defined times would need to be fed through the StrToTimeFMT function prior to use in this function to establish the proper formatting. |
SecondsBetween(start time,end time) |
Counts the number of seconds between the start time and the end time.
The keywords $BTIM or $ETIM can be used for the start and end times. However, user-defined times would need to be fed through the StrToTimeFMT function prior to use in this function to establish the proper formatting. |
StrToDateFMT(text, "format", "delimiter") |
Returns a date string in the format as defined by the user, using the specifier displays as seen in FormatDateTime("format","Date or Time") of ddmmyyyy using the delimiter designated, such as "/". |
StrToTimeFMT(text, "time delimiter", "millisecond delimiter") |
Returns a time string using a time delimiter and a millisecond delimiter. |
TimeKWToTime("TimeKeyword")
|
Converts the value of the FCS keyword format of $BTIM or $ETIM (HH:MM:SS, or HH:MM:SS:MSEC, or HH:MM:SS.MSEC) to a standard time format that can be displayed flexibly using the Windows settings. |
YearsBetween(Start Date,End Date) |
Returns the number of years between the values entered for the Start Date and End Date.
Dates in anything other than a mm/dd/yyyy format will need to be run through DateKWToDate and/or FormatDateTime prior to being used within this function. |
Regression. Regression functions allow a custom token to retrieve the X (or the Y) value for a given Y (or a given X) from several regression functions, extract a fit variable and value, and/or perform a fit of the specified X-Y values to a particular equation.
Function |
Description |
|---|---|
BoltzmannXToY(x, [modelParameters])
|
The function returns the unknown Y value of the Boltzmann regression fit given the X input value and modelParameters.
modelParameters represent a comma delimited list of all of the fit variables and their fit values: Bottom, Top, V50, Slope, and r2. It is an available Statistic Token. It can be found under Regression Parameter Statistics and appears as Model Parameters.
Only a single input X value is allowed. |
BoltzmannYToX(y, [modelParameters])
|
The function returns the unknown X value of the Boltzmann regression fit given the Y input value and modelParameters.
modelParameters represent a comma delimited list of all of the fit variables and their fit values: Bottom, Top, V50, Slope, and r2. It is an available Statistic Token. It can be found under Regression Parameter Statistics and appears as Model Parameters.
Only a single input Y value is allowed. |
CubicXToY(x, [modelParameters])
|
The function returns the unknown Y value of the Cubic regression fit given the X input value and modelParameters.
modelParameters represent a comma delimited list of all of the fit variables and their fit values: m, b, A2, A3, and r2. It is an available Statistic Token. It can be found under Regression Parameter Statistics and appears as Model Parameters.
Only a single input X value is allowed. |
CubicYToX(y, [modelParameters])
|
The function returns the unknown X value of the Cubic regression fit given the Y input value and modelParameters.
modelParameters represent a comma delimited list of all of the fit variables and their fit values: m, b, A2, A3, and r2.It is an available Statistic Token. It can be found under Regression Parameter Statistics and appears as Model Parameters.
Only a single input Y value is allowed. |
ExpAssociationXToY(x, [modelParameters])
|
The function returns the unknown Y value of the Exponential Association regression fit given the X input value and modelParameters.
modelParameters represent a comma delimited list of all of the fit variables and their fit values: Ymax1, K1, and r2. It is an available Statistic Token. It can be found under Regression Parameter Statistics and appears as Model Parameters.
Only a single input X value is allowed. |
ExpAssociationYToX(y, [modelParameters])
|
The function returns the unknown X value of the Exponential Association regression fit given the Y input value and modelParameters.
modelParameters represent a comma delimited list of all of the fit variables and their fit values: Ymax1, K1, and r2. It is an available Statistic Token. It can be found under Regression Parameter Statistics and appears as Model Parameters.
Only a single input Y value is allowed. |
ExponentialGrowXToY(x, [modelParameters])
|
The function returns the unknown Y value of the Exponential Grow regression fit given the X input value and modelParameters.
modelParameters represent a comma delimited list of all of the fit variables and their fit values: A, B, C, and r2. It is an available Statistic Token. It can be found under Regression Parameter Statistics and appears as Model Parameters.
Only a single input X value is allowed. |
ExponentialGrowYToX(y, [modelParameters])
|
The function returns the unknown X value of the Exponential Grow regression fit given the Y input value and modelParameters.
modelParameters represent a comma delimited list of all of the fit variables and their fit values: A, B, C, and r2. It is an available Statistic Token. It can be found under Regression Parameter Statistics and appears as Model Parameters.
Only a single input Y value is allowed. |
ExponentialXToY(x, [modelParameters])
|
The function returns the unknown Y value of the Exponential regression fit given the X input value and modelParameters.
modelParameters represent a comma delimited list of all of the fit variables and their fit values: A, M, C, and r2. It is an available Statistic Token. It can be found under Regression Parameter Statistics and appears as Model Parameters.
Only a single input X value is allowed. |
ExponentialYToX(y, [modelParameters]) |
The function returns the unknown X value of the Exponential regression fit given the Y input value and modelParameters.
modelParameters represent a comma delimited list of all of the fit variables and their fit values: A, M, C, and r2. It is an available Statistic Token. It can be found under Regression Parameter Statistics and appears as Model Parameters.
Only a single input Y value is allowed. |
ExtractBoltzmannResults([modelParameters], "Bottom" | "Top" | "V50" | "Slope" | "r2")
|
Extracts a particular variable from the custom token modelParameters of the Boltzmann regression fit. The fit value of the defined variable will be reported. "|" represents "or" and only one variable can be used. Other variables must be deleted.
modelParameters include: Bottom, Top, V50, Slope, and r2. It is an available Statistic Token. It can be found under Regression Parameter Statistics and appears as Model Parameters.
For example: ExtractBoltzmannResults([modelParameters], "Bottom") will report the value of the Bottom variable. |
ExtractCubicResults([modelParameters], "m" | "b" | "A2" | "A3" | "r2")
|
Extracts a particular variable from the custom token modelParameters of the Cubic regression fit. The fit value of the defined variable will be reported. "|" represents "or" and only one variable can be used. Other variables must be deleted.
modelParameters include: m, b, A2, A3, and r2. It is an available Statistic Token. It can be found under Regression Parameter Statistics and appears as Model Parameters.
For example: ExtractCubicResults([modelParameters], "m") will report the value of the m variable. |
ExtractExpAssociationResults([modelParameters], "Ymax1" | "K1" | "r2")
|
Extracts a particular variable from the custom token modelParameters of the Exponential Association regression fit. The fit value of the defined variable will be reported. "|" represents "or" and only one variable can be used. Other variables must be deleted.
modelParameters include: Ymax1, K1, and r2. It is an available Statistic Token. It can be found under Regression Parameter Statistics and appears as Model Parameters.
For example: ExtractExpAssociationResults([modelParameters], "Ymax1") will report the value of the Ymax1 variable. |
ExtractExponentialGrowResults([modelParameters], "A" | "B" | "C" | "r2")
|
Extracts a particular variable from the custom token modelParameters of the Exponential Grow regression fit. The fit value of the defined variable will be reported. "|" represents "or" and only one variable can be used. Other variables must be deleted..
modelParameters include: Ymax1, K1, and r2. It is an available Statistic Token. It can be found under Regression Parameter Statistics and appears as Model Parameters.
For example: ExtractExpAssociationResults([modelParameters], "Ymax1") will report the value of the Ymax1 variable. |
ExtractExponentialResults([modelParameters], "A" | "M" | "C" | "r2")
|
Extracts a particular variable from the custom token modelParameters of the Exponential regression fit. The fit value of the defined variable will be reported. "|" represents "or" and only one variable can be used. Other variables must be deleted.
modelParameters include: Ymax1, K1, and r2. It is an available Statistic Token. It can be found under Regression Parameter Statistics and appears as Model Parameters.
For example: ExtractExpAssociationResults([modelParameters], "Ymax1") will report the value of the Ymax1 variable. |
ExtractFiveParmLogisticResults([modelParameters], "Imin" | "Imax" | "IC50" | "HillSlope" | "Asymmetry" | "r2")
|
Extracts a particular variable from the custom token modelParameters of the Five Parameter Logistic (5PL) regression fit. The fit value of the defined variable will be reported. "|" represents "or" and only one variable can be used. Other variables must be deleted.
modelParameters include: Imin, Imax, IC50, HillSlope, Asymmetry, and r2. It is an available Statistic Token. It can be found under Regression Parameter Statistics and appears as Model Parameters.
For example: ExtractFiveParmLogisticResults([modelParameters], "Imax") will report the value of the Imax variable. |
ExtractFiveParmLogLogisticResults([modelParameters], "Imin" | "Imax" | "Midpoint" | "HillSlope" | "Asymmetry" | "r2" | "IC50")
|
Extracts a particular variable from the custom token modelParameters of the Five Parameter Log Logistic regression fit. The fit value of the defined variable will be reported. "|" represents "or" and only one variable can be used. Other variables must be deleted.
modelParameters include: Imin, Imax, IC50, Midpoint, HillSlope, Asymmetry, r2 and IC50. It is an available Statistic Token. It can be found under Regression Parameter Statistics and appears as Model Parameters.
For example: ExtractFiveParmLogisticResults([modelParameters], "Midpoint") will report the value of the Midpoint variable. |
ExtractFourParmLogisticResults([modelParameters], "Imin" | "Imax" | "IC50" | "HillSlope" | "r2")
|
Extracts a particular variable from the custom token modelParameters of the Four Parameter Logistic (4PL) regression fit. The fit value of the defined variable will be reported. "|" represents "or" and only one variable can be used. Other variables must be deleted.
modelParameters include: Imin, Imax, IC50, HillSlope, Asymmetry, and r2. It is an available Statistic Token. It can be found under Regression Parameter Statistics and appears as Model Parameters.
For example: ExtractFiveParmLogisticResults([modelParameters], "Imax") will report the value of the Imax variable. |
ExtractFourParmLogLogisticResults([modelParameters], "Imin" | "Imax" | "Midpoint" | "HillSlope" | "r2" | "IC50")
|
Extracts a particular variable from the custom token modelParameters of the Four Parameter Log Logistic regression fit. The fit value of the defined variable will be reported. "|" represents "or" and only one variable can be used. Other variables must be deleted.
modelParameters include: Imin, Imax, IC50, Midpoint, HillSlope, Asymmetry, r2 and IC50. It is an available Statistic Token. It can be found under Regression Parameter Statistics and appears as Model Parameters.
For example: ExtractFiveParmLogisticResults([modelParameters], "Midpoint") will report the value of the Midpoint variable. |
ExtractGaussianResults([modelParameters], "A" | "SD" | "xMed" | "K" | "r2")
|
Extracts a particular variable from the custom token modelParameters of the Gaussian regression fit. The fit value of the defined variable will be reported. "|" represents "or" and only one variable can be used. Other variables must be deleted.
modelParameters include: A, SD, xMed, K, and r2. It is an available Statistic Token. It can be found under Regression Parameter Statistics and appears as Model Parameters.
For example: ExtractGaussianResults([modelParameters], "A") will report the value of the A variable. |
ExtractLinearResults([modelParameters], "m" | "b" | "r2")
|
Extracts a particular variable from the custom token modelParameters of the Linear regression fit. The fit value of the defined variable will be reported. "|" represents "or" and only one variable can be used. Other variables must be deleted.
modelParameters include: m, b, and r2. It is an available Statistic Token. It can be found under Regression Parameter Statistics and appears as Model Parameters.
For example: ExtractLinearResults([modelParameters], "m") will report the value of the m variable. |
ExtractMichMentenResults([modelParameters], "Vm" | "KM" | "r2")
|
Extracts a particular variable from the custom token modelParameters of the Michaelis Menten regression fit. The fit value of the defined variable will be reported. "|" represents "or" and only one variable can be used. Other variables must be deleted.
modelParameters include: Vm, KM, and r2. It is an available Statistic Token. It can be found under Regression Parameter Statistics and appears as Model Parameters.
For example: ExtractMichMentenResults([modelParameters], "Vm") will report the value of the Vm variable. |
ExtractParabolicResults([modelParameters], "m" | "b" | "A2" | "r2")
|
Extracts a particular variable from the custom token modelParameters of the Parabolic regression fit. The fit value of the defined variable will be reported. "|" represents "or" and only one variable can be used. Other variables must be deleted.
modelParameters include: m, b, and r2. It is an available Statistic Token. It can be found under Regression Parameter Statistics and appears as Model Parameters.
For example: ExtractParabolicResults([modelParameters], "b") will report the value of the b variable. |
ExtractPowerResults([modelParameters], "A1" | "B1" | "K" | "r2")
|
Extracts a particular variable from the custom token modelParameters of the Power regression fit. The fit value of the defined variable will be reported. "|" represents "or" and only one variable can be used. Other variables must be deleted.
modelParameters include: A1, B1, K, and r2. It is an available Statistic Token. It can be found under Regression Parameter Statistics and appears as Model Parameters.
For example: ExtractPowerResults([modelParameters], "K") will report the value of the K variable. |
ExtractPowerSeriesResults([modelParameters], "A1" | "B1" | "K" | "A2" | "B2" | "r2")
|
Extracts a particular variable from the custom token modelParameters of the Power Series regression fit. The fit value of the defined variable will be reported. "|" represents "or" and only one variable can be used. Other variables must be deleted.
modelParameters include: A1, B1, K, A2, B2, and r2. It is an available Statistic Token. It can be found under Regression Parameter Statistics and appears as Model Parameters.
For example: ExtractPowerSeriesResults([modelParameters], "B2") will report the value of the B2 variable. |
ExtractSigmoidalDecResults([modelParameters], "A" | "B" | "C" | "r2")
|
Extracts a particular variable from the custom token modelParameters of the Decreasing Sigmoidal regression fit. The fit value of the defined variable will be reported. "|" represents "or" and only one variable can be used. Other variables must be deleted.
modelParameters include: A, B, C, and r2. It is an available Statistic Token. It can be found under Regression Parameter Statistics and appears as Model Parameters.
For example: ExtractSigmoidalDecResults([modelParameters], "C") will report the value of the C variable. |
ExtractSigmoidalResults([modelParameters], "A" | "B" | "C" | "r2")
|
Extracts a particular variable from the custom token modelParameters of the Sigmoidal regression fit. The fit value of the defined variable will be reported. "|" represents "or" and only one variable can be used. Other variables must be deleted.
modelParameters include: A, B, C, and r2. It is an available Statistic Token. It can be found under Regression Parameter Statistics and appears as Model Parameters.
For example: ExtractSigmoidalResults([modelParameters], "B") will report the value of the B variable. |
ExtractSineWaveResults([modelParameters], "Baseline" | "Amplitude" | "Frequency" | "Offset" | "r2")
|
Extracts a particular variable from the custom token modelParameters of the Sine Wave regression fit. The fit value of the defined variable will be reported. "|" represents "or" and only one variable can be used. Other variables must be deleted.
modelParameters include: Baseline, Amplitude, Frequency, Offset and r2. It is an available Statistic Token. It can be found under Regression Parameter Statistics and appears as Model Parameters.
For example: ExtractSineWaveResults([modelParameters], "Frequency") will report the value of the Frequency variable. |
ExtractTwoPhaseExpAssociationResults([modelParameters], "Ymax1" | "K1" | "Ymax2" | "K2" | "r2")
|
Extracts a particular variable from the custom token modelParameters of the Two Phase Exponential Association regression fit. The fit value of the defined variable will be reported. "|" represents "or" and only one variable can be used. Other variables must be deleted.
modelParameters include: Ymax1, K1, Ymax2, K2 and r2. It is an available Statistic Token. It can be found under Regression Parameter Statistics and appears as Model Parameters.
For example: ExtractTwoPhaseExpAssociationResults([modelParameters], "Ymax2") will report the value of the Ymax2 variable. |
ExtractTwoPhaseExponentialResults([modelParameters], "A" | "M" | "C" | "A2" | "M2" | "r2")
|
Extracts a particular variable from the custom token modelParameters of the Two Phase Exponential regression fit. The fit value of the defined variable will be reported. "|" represents "or" and only one variable can be used. Other variables must be deleted.
modelParameters include: A, M, C, A2, M2 and r2. It is an available Statistic Token. It can be found under Regression Parameter Statistics and appears as Model Parameters.
For example: ExtractTwoPhaseExponentialResults([modelParameters], "A") will report the value of the A variable. |
ExtractTwoSiteBindingResults([modelParameters], "Vm" | "KM" | "Vm2" | "KM2" | "r2")
|
Extracts a particular variable from the custom token modelParameters of the Two Phase Exponential regression fit. The fit value of the defined variable will be reported. "|" represents "or" and only one variable can be used. Other variables must be deleted.
modelParameters include: A, M, C, A2, M2 and r2. It is an available Statistic Token. It can be found under Regression Parameter Statistics and appears as Model Parameters.
For example: ExtractTwoPhaseExponentialResults([modelParameters], "A") will report the value of the A variable. |
FiveParmLogisticXToY(x, [modelParameters])
|
The function returns the unknown Y value of the Five Parameter Logistic regression fit given the X input value and modelParameters.
modelParameters represent a comma delimited list of all of the fit variables and their fit values: Imin, Imax, IC50, HillSlope, Asymmetry, and r2. It is an available Statistic Token. It can be found under Regression Parameter Statistics and appears as Model Parameters.
Only a single input X value is allowed. |
FiveParmLogisticYToX(y, [modelParameters])
|
The function returns the unknown X value of the Five Parameter Logistic regression fit given the Y input value and modelParameters.
modelParameters represent a comma delimited list of all of the fit variables and their fit values: Imin, Imax, IC50, HillSlope, Asymmetry, and r2. It is an available Statistic Token. It can be found under Regression Parameter Statistics and appears as Model Parameters.
Only a single input Y value is allowed. |
FiveParmLogLogisticXToY(x, [modelParameters])
|
The function returns the unknown Y value of the Five Parameter Log Logistic regression fit given the X input value and modelParameters.
modelParameters represent a comma delimited list of all of the fit variables and their fit values: Imin, Imax, Midpoint, HillSlope, Asymmetry, r2 and IC50. It is an available Statistic Token. It can be found under Regression Parameter Statistics and appears as Model Parameters.
Only a single input X value is allowed. |
FiveParmLogLogisticYToX(y, [modelParameters])
|
The function returns the unknown X value of the Five Parameter Log Logistic regression fit given the Y input value and modelParameters.
modelParameters represent a comma delimited list of all of the fit variables and their fit values: Imin, Imax, Midpoint, HillSlope, Asymmetry, r2 and IC50. It is an available Statistic Token. It can be found under Regression Parameter Statistics and appears as Model Parameters.
Only a single input Y value is allowed. |
FourParmLogisticXToY(x, [modelParameters])
|
The function returns the unknown Y value of the Four Parameter Logistic regression fit given the X input value and modelParameters.
modelParameters represent a comma delimited list of all of the fit variables and their fit values: Imin, Imax, IC50, HillSlope, and r2. It is an available Statistic Token. It can be found under Regression Parameter Statistics and appears as Model Parameters.
Only a single input X value is allowed. |
FourParmLogisticYToX(y, [modelParameters])
|
The function returns the unknown X value of the Four Parameter Logistic regression fit given the Y input value and modelParameters.
modelParameters represent a comma delimited list of all of the fit variables and their fit values: Imin, Imax, IC50, HillSlope, and r2. It is an available Statistic Token. It can be found under Regression Parameter Statistics and appears as Model Parameters.
Only a single input Y value is allowed. |
FourParmLogLogisticXToY(x, [modelParameters])
|
The function returns the unknown Y value of the Four Parameter Log Logistic regression fit given the X input value and modelParameters.
modelParameters represent a comma delimited list of all of the fit variables and their fit values: Imin, Imax, Midpoing, HillSlope, r2, and IC50. It is an available Statistic Token. It can be found under Regression Parameter Statistics and appears as Model Parameters.
Only a single input X value is allowed. |
FourParmLogLogisticYToX(y, [modelParameters])
|
The function returns the unknown X value of the Four Parameter Log Logistic regression fit given the Y input value and modelParameters.
modelParameters represent a comma delimited list of all of the fit variables and their fit values: Imin, Imax, Midpoing, HillSlope, r2, and IC50. It is an available Statistic Token. It can be found under Regression Parameter Statistics and appears as Model Parameters.
Only a single input Y value is allowed. |
GaussianXToY(x, [modelParameters])
|
The function returns the unknown Y value of the Gaussian regression fit given the X input value and modelParameters.
modelParameters represent a comma delimited list of all of the fit variables and their fit values: A, SD, xMed, K, and r2. It is an available Statistic Token. It can be found under Regression Parameter Statistics and appears as Model Parameters.
Only a single input X value is allowed. |
GaussianYToX(y, [modelParameters]) |
The function returns the unknown X value of the Gaussian regression fit given the Y input value and modelParameters.
modelParameters represent a comma delimited list of all of the fit variables and their fit values: A, SD, xMed, K, and r2. It is an available Statistic Token. It can be found under Regression Parameter Statistics and appears as Model Parameters.
Only a single input Y value is allowed. |
LinearXToY(x, [modelParameters])
|
The function returns the unknown Y value of the Linear regression fit given the X input value and modelParameters.
modelParameters represent a comma delimited list of all of the fit variables and their fit values: m, b, and r2. It is an available Statistic Token. It can be found under Regression Parameter Statistics and appears as Model Parameters.
Only a single input X value is allowed. |
LinearYToX(y, [modelParameters])
|
The function returns the unknown X value of the Linear regression fit given the Y input value and modelParameters.
modelParameters represent a comma delimited list of all of the fit variables and their fit values: m, b, and r2. It is an available Statistic Token. It can be found under Regression Parameter Statistics and appears as Model Parameters.
Only a single input Y value is allowed. |
MichMentenXToY(x, [modelParameters])
|
The function returns the unknown Y value of the Michaelis Menten regression fit given the X input value and modelParameters.
modelParameters represent a comma delimited list of all of the fit variables and their fit values: Vm, KM, and r2. It is an available Statistic Token. It can be found under Regression Parameter Statistics and appears as Model Parameters.
Only a single input X value is allowed. |
MichMentenYToX(y, [modelParameters])
|
The function returns the unknown X value of the Michaelis Menten regression fit given the Y input value and modelParameters.
modelParameters represent a comma delimited list of all of the fit variables and their fit values: Vm, KM, and r2. It is an available Statistic Token. It can be found under Regression Parameter Statistics and appears as Model Parameters.
Only a single input Y value is allowed. |
ParabolicXToY(x, [modelParameters])
|
The function returns the unknown Y value of the Parabolic regression fit given the X input value and modelParameters.
modelParameters represent a comma delimited list of all of the fit variables and their fit values: m, b, A2, and r2. It is an available Statistic Token. It can be found under Regression Parameter Statistics and appears as Model Parameters.
Only a single input X value is allowed. |
ParabolicYToX(y, [modelParameters])
|
The function returns the unknown X value of the Parabolic regression fit given the Y input value and modelParameters.
modelParameters represent a comma delimited list of all of the fit variables and their fit values: m, b, A2, and r2. It is an available Statistic Token. It can be found under Regression Parameter Statistics and appears as Model Parameters.
Only a single input Y value is allowed. |
PerformBoltzmannFit([xValues], [yValues], [SDvalues], [fixedParameters])
|
This function Performs a fit of the specified X-Y values to the Boltzmann regression fit equation.
Where X Values is a comma delimited list of X values, generally specified by a series of tokens. Where Y Values is a comma delimited list of Y values, generally specified by a series of tokens.
SD, or Standard Deviation, allows you to specify a standard deviation for each list of the Y values, generally specified by a series of tokens. The SD value assigns a "weight" to each associated X and Y value with a lower SD value resulting in a higher weight and a higher SD value resulting in a lower weight. If the SD is not specified, an SD of zero is assumed for each Y value.
Fixed Parameters allows you to specify variables that should not be fit, but will be forced to use the value that you specify. The format of the Fixed parameters is a comma delimited list of var=value where var is one of the available variables (Bottom, Top, V50, Slope) and value is the value to fix it to.
All fit variables and their value will be reported. |
PerformCubicFit([xValues], [yValues], [SDvalues], [fixedParameters])
|
This function Performs a fit of the specified X-Y values to the Cubic regression fit equation.
Where X Values is a comma delimited list of X values, generally specified by a series of tokens. Where Y Values is a comma delimited list of Y values, generally specified by a series of tokens.
SD, or Standard Deviation, allows you to specify a standard deviation for each list of the Y values, generally specified by a series of tokens. The SD value assigns a "weight" to each associated X and Y value with a lower SD value resulting in a higher weight and a higher SD value resulting in a lower weight. If the SD is not specified, an SD of zero is assumed for each Y value.
Fixed Parameters allows you to specify variables that should not be fit, but will be forced to use the value that you specify. The format of the Fixed parameters is a comma delimited list of var=value where var is one of the available variables (m, b, A2, A3) and value is the value to fix it to.
All fit variables and their value will be reported. |
PerformExpAssociationFit([xValues], [yValues], [SDvalues], [fixedParameters])
|
This function Performs a fit of the specified X-Y values to the Exponential Association regression fit equation.
Where X Values is a comma delimited list of X values, generally specified by a series of tokens. Where Y Values is a comma delimited list of Y values, generally specified by a series of tokens.
SD, or Standard Deviation, allows you to specify a standard deviation for each list of the Y values, generally specified by a series of tokens. The SD value assigns a "weight" to each associated X and Y value with a lower SD value resulting in a higher weight and a higher SD value resulting in a lower weight. If the SD is not specified, an SD of zero is assumed for each Y value.
Fixed Parameters allows you to specify variables that should not be fit, but will be forced to use the value that you specify. The format of the Fixed parameters is a comma delimited list of var=value where var is one of the available variables (Ymax1, K1) and value is the value to fix it to.
All fit variables and their value will be reported. |
PerformExponentialFit([xValues], [yValues], [SDvalues], [fixedParameters])
|
This function Performs a fit of the specified X-Y values to the Exponential regression fit equation.
Where X Values is a comma delimited list of X values, generally specified by a series of tokens. Where Y Values is a comma delimited list of Y values, generally specified by a series of tokens.
SD, or Standard Deviation, allows you to specify a standard deviation for each list of the Y values, generally specified by a series of tokens. The SD value assigns a "weight" to each associated X and Y value with a lower SD value resulting in a higher weight and a higher SD value resulting in a lower weight. If the SD is not specified, an SD of zero is assumed for each Y value.
Fixed Parameters allows you to specify variables that should not be fit, but will be forced to use the value that you specify. The format of the Fixed parameters is a comma delimited list of var=value where var is one of the available variables (A, M, C) and value is the value to fix it to.
All fit variables and their value will be reported. |
PerformExponentialGrowFit([xValues], [yValues], [SDvalues], [fixedParameters])
|
This function Performs a fit of the specified X-Y values to the Exponential Grow regression fit equation.
Where X Values is a comma delimited list of X values, generally specified by a series of tokens. Where Y Values is a comma delimited list of Y values, generally specified by a series of tokens.
SD, or Standard Deviation, allows you to specify a standard deviation for each list of the Y values, generally specified by a series of tokens. The SD value assigns a "weight" to each associated X and Y value with a lower SD value resulting in a higher weight and a higher SD value resulting in a lower weight. If the SD is not specified, an SD of zero is assumed for each Y value.
Fixed Parameters allows you to specify variables that should not be fit, but will be forced to use the value that you specify. The format of the Fixed parameters is a comma delimited list of var=value where var is one of the available variables (A, M, C) and value is the value to fix it to.
All fit variables and their value will be reported. |
PerformFiveParmLogisticFit([xValues], [yValues], [SDvalues], [fixedParameters])
|
This function Performs a fit of the specified X-Y values to the Five Parameter Logistic regression fit equation.
Where X Values is a comma delimited list of X values, generally specified by a series of tokens. Where Y Values is a comma delimited list of Y values, generally specified by a series of tokens.
SD, or Standard Deviation, allows you to specify a standard deviation for each list of the Y values, generally specified by a series of tokens. The SD value assigns a "weight" to each associated X and Y value with a lower SD value resulting in a higher weight and a higher SD value resulting in a lower weight. If the SD is not specified, an SD of zero is assumed for each Y value.
Fixed Parameters allows you to specify variables that should not be fit, but will be forced to use the value that you specify. The format of the Fixed parameters is a comma delimited list of var=value where var is one of the available variables (Imin, Imax, IC50, HillSlope, Asymmetry) and value is the value to fix it to.
All fit variables and their value will be reported. |
PerformFiveParmLogLogisticFit([xValues], [yValues], [SDvalues], [fixedParameters])
|
This function Performs a fit of the specified X-Y values to the Five Parameter Log Logistic regression fit equation.
Where X Values is a comma delimited list of X values, generally specified by a series of tokens. Where Y Values is a comma delimited list of Y values, generally specified by a series of tokens.
SD, or Standard Deviation, allows you to specify a standard deviation for each list of the Y values, generally specified by a series of tokens. The SD value assigns a "weight" to each associated X and Y value with a lower SD value resulting in a higher weight and a higher SD value resulting in a lower weight. If the SD is not specified, an SD of zero is assumed for each Y value.
Fixed Parameters allows you to specify variables that should not be fit, but will be forced to use the value that you specify. The format of the Fixed parameters is a comma delimited list of var=value where var is one of the available variables (Imin, Imax, Midpoint, HillSlope, Asymmetry, IC50) and value is the value to fix it to.
All fit variables and their value will be reported. |
PerformFourParmLogisticFit([xValues], [yValues], [SDvalues], [fixedParameters])
|
This function Performs a fit of the specified X-Y values to the Four Parameter Logistic regression fit equation.
Where X Values is a comma delimited list of X values, generally specified by a series of tokens. Where Y Values is a comma delimited list of Y values, generally specified by a series of tokens.
SD, or Standard Deviation, allows you to specify a standard deviation for each list of the Y values, generally specified by a series of tokens. The SD value assigns a "weight" to each associated X and Y value with a lower SD value resulting in a higher weight and a higher SD value resulting in a lower weight. If the SD is not specified, an SD of zero is assumed for each Y value.
Fixed Parameters allows you to specify variables that should not be fit, but will be forced to use the value that you specify. The format of the Fixed parameters is a comma delimited list of var=value where var is one of the available variables (Imin, Imax, IC50, HillSlope) and value is the value to fix it to.
All fit variables and their value will be reported. |
PerformFourParmLogLogisticFit([xValues], [yValues], [SDvalues], [fixedParameters])
|
This function Performs a fit of the specified X-Y values to the Four Parameter Log Logistic regression fit equation.
Where X Values is a comma delimited list of X values, generally specified by a series of tokens. Where Y Values is a comma delimited list of Y values, generally specified by a series of tokens.
SD, or Standard Deviation, allows you to specify a standard deviation for each list of the Y values, generally specified by a series of tokens. The SD value assigns a "weight" to each associated X and Y value with a lower SD value resulting in a higher weight and a higher SD value resulting in a lower weight. If the SD is not specified, an SD of zero is assumed for each Y value.
Fixed Parameters allows you to specify variables that should not be fit, but will be forced to use the value that you specify. The format of the Fixed parameters is a comma delimited list of var=value where var is one of the available variables (Imin, Imax, Midpoint, HillSlope, IC50) and value is the value to fix it to.
All fit variables and their value will be reported. |
PerformGaussianFit([xValues], [yValues], [SDvalues], [fixedParameters])
|
This function Performs a fit of the specified X-Y values to the Gaussian regression fit equation.
Where X Values is a comma delimited list of X values, generally specified by a series of tokens. Where Y Values is a comma delimited list of Y values, generally specified by a series of tokens.
SD, or Standard Deviation, allows you to specify a standard deviation for each list of the Y values, generally specified by a series of tokens. The SD value assigns a "weight" to each associated X and Y value with a lower SD value resulting in a higher weight and a higher SD value resulting in a lower weight. If the SD is not specified, an SD of zero is assumed for each Y value.
Fixed Parameters allows you to specify variables that should not be fit, but will be forced to use the value that you specify. The format of the Fixed parameters is a comma delimited list of var=value where var is one of the available variables (A, SD, xMed, K) and value is the value to fix it to.
All fit variables and their value will be reported. |
PerformLinearFit([xValues], [yValues], [SDvalues], [fixedParameters])
|
This function Performs a fit of the specified X-Y values to the Linear regression fit equation.
Where X Values is a comma delimited list of X values, generally specified by a series of tokens. Where Y Values is a comma delimited list of Y values, generally specified by a series of tokens.
SD, or Standard Deviation, allows you to specify a standard deviation for each list of the Y values, generally specified by a series of tokens. The SD value assigns a "weight" to each associated X and Y value with a lower SD value resulting in a higher weight and a higher SD value resulting in a lower weight. If the SD is not specified, an SD of zero is assumed for each Y value.
Fixed Parameters allows you to specify variables that should not be fit, but will be forced to use the value that you specify. The format of the Fixed parameters is a comma delimited list of var=value where var is one of the available variables (m, b) and value is the value to fix it to.
All fit variables and their value will be reported. |
PerformMichMentenFit([xValues], [yValues], [SDvalues], [fixedParameters])
|
This function Performs a fit of the specified X-Y values to the Michaelis Menten regression fit equation.
Where X Values is a comma delimited list of X values, generally specified by a series of tokens. Where Y Values is a comma delimited list of Y values, generally specified by a series of tokens.
SD, or Standard Deviation, allows you to specify a standard deviation for each list of the Y values, generally specified by a series of tokens. The SD value assigns a "weight" to each associated X and Y value with a lower SD value resulting in a higher weight and a higher SD value resulting in a lower weight. If the SD is not specified, an SD of zero is assumed for each Y value.
Fixed Parameters allows you to specify variables that should not be fit, but will be forced to use the value that you specify. The format of the Fixed parameters is a comma delimited list of var=value where var is one of the available variables (Vm, KM) and value is the value to fix it to.
All fit variables and their value will be reported. |
PerformParabolicFit([xValues], [yValues], [SDvalues], [fixedParameters])
|
This function Performs a fit of the specified X-Y values to the Parabolic regression fit equation.
Where X Values is a comma delimited list of X values, generally specified by a series of tokens. Where Y Values is a comma delimited list of Y values, generally specified by a series of tokens.
SD, or Standard Deviation, allows you to specify a standard deviation for each list of the Y values, generally specified by a series of tokens. The SD value assigns a "weight" to each associated X and Y value with a lower SD value resulting in a higher weight and a higher SD value resulting in a lower weight. If the SD is not specified, an SD of zero is assumed for each Y value.
Fixed Parameters allows you to specify variables that should not be fit, but will be forced to use the value that you specify. The format of the Fixed parameters is a comma delimited list of var=value where var is one of the available variables (m, b, A2) and value is the value to fix it to.
All fit variables and their value will be reported. |
PerformPowerFit([xValues], [yValues], [SDvalues], [fixedParameters])
|
This function Performs a fit of the specified X-Y values to the Power regression fit equation.
Where X Values is a comma delimited list of X values, generally specified by a series of tokens. Where Y Values is a comma delimited list of Y values, generally specified by a series of tokens.
SD, or Standard Deviation, allows you to specify a standard deviation for each list of the Y values, generally specified by a series of tokens. The SD value assigns a "weight" to each associated X and Y value with a lower SD value resulting in a higher weight and a higher SD value resulting in a lower weight. If the SD is not specified, an SD of zero is assumed for each Y value.
Fixed Parameters allows you to specify variables that should not be fit, but will be forced to use the value that you specify. The format of the Fixed parameters is a comma delimited list of var=value where var is one of the available variables (A1, B1, K) and value is the value to fix it to.
All fit variables and their value will be reported. |
PerformPowerSeriesFit([xValues], [yValues], [SDvalues], [fixedParameters])
|
This function Performs a fit of the specified X-Y values to the Power Series regression fit equation.
Where X Values is a comma delimited list of X values, generally specified by a series of tokens. Where Y Values is a comma delimited list of Y values, generally specified by a series of tokens.
SD, or Standard Deviation, allows you to specify a standard deviation for each list of the Y values, generally specified by a series of tokens. The SD value assigns a "weight" to each associated X and Y value with a lower SD value resulting in a higher weight and a higher SD value resulting in a lower weight. If the SD is not specified, an SD of zero is assumed for each Y value.
Fixed Parameters allows you to specify variables that should not be fit, but will be forced to use the value that you specify. The format of the Fixed parameters is a comma delimited list of var=value where var is one of the available variables (A1, B1, K, A2, B2) and value is the value to fix it to.
All fit variables and their value will be reported. |
PerformSigmoidalDecFit([xValues], [yValues], [SDvalues], [fixedParameters])
|
This function Performs a fit of the specified X-Y values to the Decreasing Sigmoidal regression fit equation.
Where X Values is a comma delimited list of X values, generally specified by a series of tokens. Where Y Values is a comma delimited list of Y values, generally specified by a series of tokens.
SD, or Standard Deviation, allows you to specify a standard deviation for each list of the Y values, generally specified by a series of tokens. The SD value assigns a "weight" to each associated X and Y value with a lower SD value resulting in a higher weight and a higher SD value resulting in a lower weight. If the SD is not specified, an SD of zero is assumed for each Y value.
Fixed Parameters allows you to specify variables that should not be fit, but will be forced to use the value that you specify. The format of the Fixed parameters is a comma delimited list of var=value where var is one of the available variables (A, B, C) and value is the value to fix it to.
All fit variables and their value will be reported. |
PerformSigmoidalFit([xValues], [yValues], [SDvalues], [fixedParameters])
|
This function Performs a fit of the specified X-Y values to the Sigmoidal regression fit equation.
Where X Values is a comma delimited list of X values, generally specified by a series of tokens. Where Y Values is a comma delimited list of Y values, generally specified by a series of tokens.
SD, or Standard Deviation, allows you to specify a standard deviation for each list of the Y values, generally specified by a series of tokens. The SD value assigns a "weight" to each associated X and Y value with a lower SD value resulting in a higher weight and a higher SD value resulting in a lower weight. If the SD is not specified, an SD of zero is assumed for each Y value.
Fixed Parameters allows you to specify variables that should not be fit, but will be forced to use the value that you specify. The format of the Fixed parameters is a comma delimited list of var=value where var is one of the available variables (A, B, C) and value is the value to fix it to.
All fit variables and their value will be reported. |
PerformSineWaveFit([xValues], [yValues], [SDvalues], [fixedParameters])
|
This function Performs a fit of the specified X-Y values to the Sine Wave regression fit equation.
Where X Values is a comma delimited list of X values, generally specified by a series of tokens. Where Y Values is a comma delimited list of Y values, generally specified by a series of tokens.
SD, or Standard Deviation, allows you to specify a standard deviation for each list of the Y values, generally specified by a series of tokens. The SD value assigns a "weight" to each associated X and Y value with a lower SD value resulting in a higher weight and a higher SD value resulting in a lower weight. If the SD is not specified, an SD of zero is assumed for each Y value.
Fixed Parameters allows you to specify variables that should not be fit, but will be forced to use the value that you specify. The format of the Fixed parameters is a comma delimited list of var=value where var is one of the available variables (Baseline, Amplitude, Frequency, Offset) and value is the value to fix it to.
All fit variables and their value will be reported. |
PerformTwoPhaseExpAssociationFit([xValues], [yValues], [SDvalues], [fixedParameters])
|
This function Performs a fit of the specified X-Y values to the Two Phase Exponential Association regression fit equation.
Where X Values is a comma delimited list of X values, generally specified by a series of tokens. Where Y Values is a comma delimited list of Y values, generally specified by a series of tokens.
SD, or Standard Deviation, allows you to specify a standard deviation for each list of the Y values, generally specified by a series of tokens. The SD value assigns a "weight" to each associated X and Y value with a lower SD value resulting in a higher weight and a higher SD value resulting in a lower weight. If the SD is not specified, an SD of zero is assumed for each Y value.
Fixed Parameters allows you to specify variables that should not be fit, but will be forced to use the value that you specify. The format of the Fixed parameters is a comma delimited list of var=value where var is one of the available variables (Ymax1, K1, Ymax2, K2) and value is the value to fix it to.
All fit variables and their value will be reported. |
PerformTwoPhaseExponentialFit([xValues], [yValues], [SDvalues], [fixedParameters])
|
This function Performs a fit of the specified X-Y values to the Two Phase Exponential regression fit equation.
Where X Values is a comma delimited list of X values, generally specified by a series of tokens. Where Y Values is a comma delimited list of Y values, generally specified by a series of tokens.
SD, or Standard Deviation, allows you to specify a standard deviation for each list of the Y values, generally specified by a series of tokens. The SD value assigns a "weight" to each associated X and Y value with a lower SD value resulting in a higher weight and a higher SD value resulting in a lower weight. If the SD is not specified, an SD of zero is assumed for each Y value.
Fixed Parameters allows you to specify variables that should not be fit, but will be forced to use the value that you specify. The format of the Fixed parameters is a comma delimited list of var=value where var is one of the available variables (A, M, C, A2, M2) and value is the value to fix it to.
All fit variables and their value will be reported. |
PerformTwoSiteBindingFit([xValues], [yValues], [SDvalues], [fixedParameters])
|
This function Performs a fit of the specified X-Y values to the Two Site Binding regression fit equation.
Where X Values is a comma delimited list of X values, generally specified by a series of tokens. Where Y Values is a comma delimited list of Y values, generally specified by a series of tokens.
SD, or Standard Deviation, allows you to specify a standard deviation for each list of the Y values, generally specified by a series of tokens. The SD value assigns a "weight" to each associated X and Y value with a lower SD value resulting in a higher weight and a higher SD value resulting in a lower weight. If the SD is not specified, an SD of zero is assumed for each Y value.
Fixed Parameters allows you to specify variables that should not be fit, but will be forced to use the value that you specify. The format of the Fixed parameters is a comma delimited list of var=value where var is one of the available variables (Vm, KM, Vm2, KM2) and value is the value to fix it to.
All fit variables and their value will be reported. |
PowerSeriesXToY(x, [modelParameters])
|
The function returns the unknown Y value of the Power Series regression fit given the X input value and modelParameters.
modelParameters represent a comma delimited list of all of the fit variables and their fit values: A1, B1, K, A2, B2, and r2. It is an available Statistic Token. It can be found under Regression Parameter Statistics and appears as Model Parameters.
Only a single input X value is allowed. |
PowerSeriesYToX(y, [modelParameters])
|
The function returns the unknown X value of the Power Series regression fit given the Y input value and modelParameters.
modelParameters represent a comma delimited list of all of the fit variables and their fit values: A1, B1, K, A2, B2, and r2. It is an available Statistic Token. It can be found under Regression Parameter Statistics and appears as Model Parameters.
Only a single input Y value is allowed. |
PowerXToY(x, [modelParameters])
|
The function returns the unknown Y value of the Power regression fit given the X input value and modelParameters.
modelParameters represent a comma delimited list of all of the fit variables and their fit values: A1, B1, K, and r2. It is an available Statistic Token. It can be found under Regression Parameter Statistics and appears as Model Parameters.
Only a single input X value is allowed. |
PowerYToX(y, [modelParameters])
|
The function returns the unknown X value of the Power regression fit given the Y input value and modelParameters.
modelParameters represent a comma delimited list of all of the fit variables and their fit values: A1, B1, K, and r2. It is an available Statistic Token. It can be found under Regression Parameter Statistics and appears as Model Parameters.
Only a single input Y value is allowed. |
RegressionPlotXToY(Plot Number, Overlay Number, X Value) |
This functions returns the Y value for a given Scatter with Regression plot fit given the X input value.
The three mandatory parameters are the Plot Number of a regression plot (numeric), the Overlay Number of a regression fit (numeric) and the X known value (numeric). Only a single input X value is allowed. |
RegressionPlotYToX(Plot Number, Overlay Number, Y Value) |
This functions returns the X value for a given Scatter with Regression plot fit given the Y input value.
The three mandatory parameters are the Plot Number of a regression plot (numeric), the Overlay Number of a regression fit (numeric) and the Y known value (numeric). Only a single input Y value is allowed. |
SigmoidalDecXToY(x, [modelParameters])
|
The function returns the unknown Y value of the Decreasing Sigmoidal regression fit given the X input value and modelParameters.
modelParameters represent a comma delimited list of all of the fit variables and their fit values: A, B, C, and r2. It is an available Statistic Token. It can be found under Regression Parameter Statistics and appears as Model Parameters.
Only a single input X value is allowed. |
SigmoidalDecYToX(y, [modelParameters])
|
The function returns the unknown X value of the Decreasing Sigmoidal regression fit given the Y input value and modelParameters.
modelParameters represent a comma delimited list of all of the fit variables and their fit values: A, B, C, and r2. It is an available Statistic Token. It can be found under Regression Parameter Statistics and appears as Model Parameters.
Only a single input Y value is allowed. |
SigmoidalXToY(x, [modelParameters])
|
The function returns the unknown Y value of the Sigmoidal regression fit given the X input value and modelParameters.
modelParameters represent a comma delimited list of all of the fit variables and their fit values: A, B, C, and r2. It is an available Statistic Token. It can be found under Regression Parameter Statistics and appears as Model Parameters.
Only a single input X value is allowed. |
SigmoidalYToX(y, [modelParameters])
|
The function returns the unknown X value of the Sigmoidal regression fit given the Y input value and modelParameters.
modelParameters represent a comma delimited list of all of the fit variables and their fit values: A, B, C, and r2. It is an available Statistic Token. It can be found under Regression Parameter Statistics and appears as Model Parameters.
Only a single input Y value is allowed. |
SineWaveXToY(x, [modelParameters])
|
The function returns the unknown Y value of the Sine Wave regression fit given the X input value and modelParameters.
modelParameters represent a comma delimited list of all of the fit variables and their fit values: Baseline, Amplitude, Frequency, Offset, and r2. It is an available Statistic Token. It can be found under Regression Parameter Statistics and appears as Model Parameters.
Only a single input X value is allowed. |
SineWaveYToX(y, [modelParameters])
|
The function returns the unknown X value of the Sine Wave regression fit given the Y input value and modelParameters.
modelParameters represent a comma delimited list of all of the fit variables and their fit values: Baseline, Amplitude, Frequency, Offset, and r2. It is an available Statistic Token. It can be found under Regression Parameter Statistics and appears as Model Parameters.
Only a single input Y value is allowed. |
TwoPhaseExpAssociationXToY(x, [modelParameters])
|
The function returns the unknown Y value of the Two Phase Exponential Association regression fit given the X input value and modelParameters.
modelParameters represent a comma delimited list of all of the fit variables and their fit values: Ymax1, K1, Ymax2, K2, and r2. It is an available Statistic Token. It can be found under Regression Parameter Statistics and appears as Model Parameters.
Only a single input X value is allowed. |
TwoPhaseExpAssociationYToX(y, [modelParameters])
|
The function returns the unknown X value of the Two Phase Exponential Association regression fit given the Y input value and modelParameters.
modelParameters represent a comma delimited list of all of the fit variables and their fit values: Ymax1, K1, Ymax2, K2, and r2. It is an available Statistic Token. It can be found under Regression Parameter Statistics and appears as Model Parameters.
Only a single input Y value is allowed. |
TwoPhaseExponentialXToY(x, [modelParameters])
|
The function returns the unknown Y value of the Two Phase Exponential regression fit given the X input value and modelParameters.
modelParameters represent a comma delimited list of all of the fit variables and their fit values: A, M, C, A2, M2, and r2. It is an available Statistic Token. It can be found under Regression Parameter Statistics and appears as Model Parameters.
Only a single input X value is allowed. |
TwoPhaseExponentialYToX(y, [modelParameters])
|
The function returns the unknown X value of the Two Phase Exponential regression fit given the Y input value and modelParameters.
modelParameters represent a comma delimited list of all of the fit variables and their fit values: A, M, C, A2, M2, and r2. It is an available Statistic Token. It can be found under Regression Parameter Statistics and appears as Model Parameters.
Only a single input Y value is allowed. |
TwoSiteBindingXToY(x, [modelParameters])
|
The function returns the unknown Y value of the Two Site Binding regression fit given the X input value and modelParameters.
modelParameters represent a comma delimited list of all of the fit variables and their fit values: Vm, KM, Vm2, KM2, and r2. It is an available Statistic Token. It can be found under Regression Parameter Statistics and appears as Model Parameters.
Only a single input X value is allowed. |
TwoSiteBindingYToX(y, [modelParameters])
|
The function returns the unknown X value of the Two Site Binding regression fit given the Y input value and modelParameters.
modelParameters represent a comma delimited list of all of the fit variables and their fit values: Vm, KM, Vm2, KM2, and r2. It is an available Statistic Token. It can be found under Regression Parameter Statistics and appears as Model Parameters.
Only a single input Y value is allowed. |
SOP (Standard Operating Procedure) Functions. These functions can be used to derive information from SOP's.
Function |
Description |
|---|---|
HasSOPBeenRun |
Returns true or false in the form of -1 (True) or 0 (False) to determine if any SOP has been previously run in the layout. |
IsSOPAfterStep(StepID) |
Returns true or false in the form of -1 (True) or 0 (False) to determine the current SOP step is after a specific SOP Internal Step ID. |
IsSOPBeforeStep(StepID) |
Returns true or false in the form of -1 (True) or 0 (False) to determine the current SOP step is before a specific SOP Internal Step ID. |
IsSOPFinished |
Returns true or false in the form of -1 (True) or 0 (False) to determine if the SOP has finished running in the layout. |
IsSOPOnStep(StepID) |
Returns true or false in the form of -1 (True) or 0 (False) to determine if the running SOP is currently on a specific SOP Internal Step ID. |
IsSOPRunning |
Returns true or false in the form of -1 (True) or 0 (False) to determine if an SOP is currently running. |
Function |
Description |
|---|---|
ConvertPlotSpilloverValueToColor(Plot Number, Overlay Number) |
Returns a color code derived from the spillover matrix. Token is used internally by FCS Express to color code plot backgrounds when drawing NXN Compensated plots. |
InterpolateColors("startColor","endColor",fraction) |
Returns a color in Hex color code based on fraction between two other colors. Start Color and End Color may be any written color names, ie Red, Green, Gray, or any Hex Color Code, ie #FF0000, #008000, #808080. The color may also be chosen from a color palette by right clicking in the formula reference area and choosing Insert Color. Fraction may be any value between 0 and 1 with 0 being the start color and 1 being the end color. By including a token such as % gated as the numerator in a formula of (%gated/100) one can achieve a specific color associated with a percent gated based on a gradient between the start and end color. The Interpolate Color result can then be used to color any object or fill that allows a token for the color, for instance, Background/Fill of objects. |
Compensation Matrix Functions. These functions can be used to derive information about the compensation matrix.
Function |
Description |
HasCompMatrixBeenChanged(PlotID, CompID) |
Evaluates if the compensation matrix has been changed. Reports TRUE for a modified matrix or FALSE for an unmodified matrix. |
Function |
Description |
|---|---|
IsDataListIterationAndTubeNameEmpty(Iteration, "Tube Name") |
This function returns TRUE if the specified Tube in the specified Iteration is a Blank tube, or, FALSE otherwise. Tube is defined by specifying the Tube name (written in quotes; non case sensitive). |
IsDataListIterationAndTubeNumberEmpty(Iteration, Tube Number) |
This function returns TRUE if the specified Tube in the specified Iteration is a Blank tube, or, FALSE otherwise. Tube is defined by specifying the Tube number. |
IsDataListPositionEmpty(Position) |
This function returns TRUE if the specified file in the Data List is a Blank tube, or, FALSE otherwise. |
System Functions. These functions can be used to derive information about the current user's Security Group.
Function |
Description |
IsCurrentUserMemberOf("GroupName") |
Returns true or false in the form of -1 (True) or 0 (False) to determine if the user belongs to the defined Security Group listed in place of "GroupName" in the parentheses. |
Channel Calibration Functions. These functions can be used to derive information about channel calibrations applied within a layout or to a specified plot.
Function |
Description |
ChannelCalibrationDetailsLayout(CalibNum,"Details",Precision) |
CalibNum is the Index number of a given calibration as seen in the Calibration Information dialog window.
Details are the specific pieces of information the user can extract from a channel calibration. The user will enter a letter (or letters) from the list below to define output information. Letters should be entered between quotes in the formula with no spacing between for multiple details, for instance "A" will return Antibodies, "AES" will return Antibodies|Equation|Status.
A: Antibodies - Determines the absolute value of fluorescent ligands labeling each cell. C: Correlation - Displays how closely the equation fits the actual data, with a value of 1 being a perfect fit. D: Decades - Represents the number of decades of dynamic range your instrument is capable of measuring. E: Equation - is the linear regression formula that was used to calibrate the channels. M: MinAb - Is the minimum number of fluorochromes you are able to resolve. P: Parameter - Displays the parameter the channel calibration applies to. R: Ratio - Refers to the dye molecules:antibody ratio S: Status - Indicates whether this calibration is active or inactive for the selected calibration. Y: DyeMolecules - The correlation of the channel number to the number of dye molecules per bead established from the standard curve.
Precision can be adjusted by the user to determine the decimal precision of the channel calibration output. Values should be positive whole numbers, eg, 1, 2, 3.
|
ChannelCalibrationDetailsPlot(PlotNum,"Axis","Details",Precision) |
PlotNum designates the plot by number that has the channel calibration applied. Plot number can be discerned by hovering the mouse over the plot to return the plot number.
Axis can be entered as "x" or "y" to indicate which axis of the plot to extract information from a parameter that currently has a calibration applied.
Details are the specific pieces of information the user can extract from a channel calibration. The user will enter a letter (or letters) from the list below to define output information. Letters should be entered between quotes in the formula with no spacing between for multiple details, for instance "A" will return Antibodies, "AES" will return Antibodies|Equation|Status.
A: Antibodies - Determines the absolute value of fluorescent ligands labeling each cell. C: Correlation - Displays how closely the equation fits the actual data, with a value of 1 being a perfect fit. D: Decades - Represents the number of decades of dynamic range your instrument is capable of measuring. E: Equation - is the linear regression formula that was used to calibrate the channels. M: MinAb - Is the minimum number of fluorochromes you are able to resolve. P: Parameter - Displays the parameter the channel calibration applies to. R: Ratio - Refers to the dye molecules:antibody ratio S: Status - Indicates whether this calibration is active or inactive for the selected calibration. Y: DyeMolecules - The correlation of the channel number to the number of dye molecules per bead established from the standard curve.
Precision can be adjusted by the user to determine the decimal precision of the channel calibration output. Values should be positive whole numbers, eg, 1, 2, 3. |