Data Stats

Contents
Statistics in a Data Stats table are calculated directly from the data file(s) in current iteration as defined by the gating hierarchy and are independent of plots showing on the layout.
There are 2 methods for displaying a Data Stats table in a layout:
Via Insert tab -> Data Stats command
Choose the Insert -> Data Stats command (Œ,), click anywhere in the layout, and a Data Stats table will appear (Ž) (Figure 11.4)
•If there is only a single data file per iteration, that data file will be used to calculate the statistics.
•If there is more than 1 data file per iteration, the last data file of the iteration that is showing in the layout will be used to calculate the statistics.
•To show the Data Stats table for a specific data file in a multi-file iteration, first select any plot showing that data file, and then insert the table.
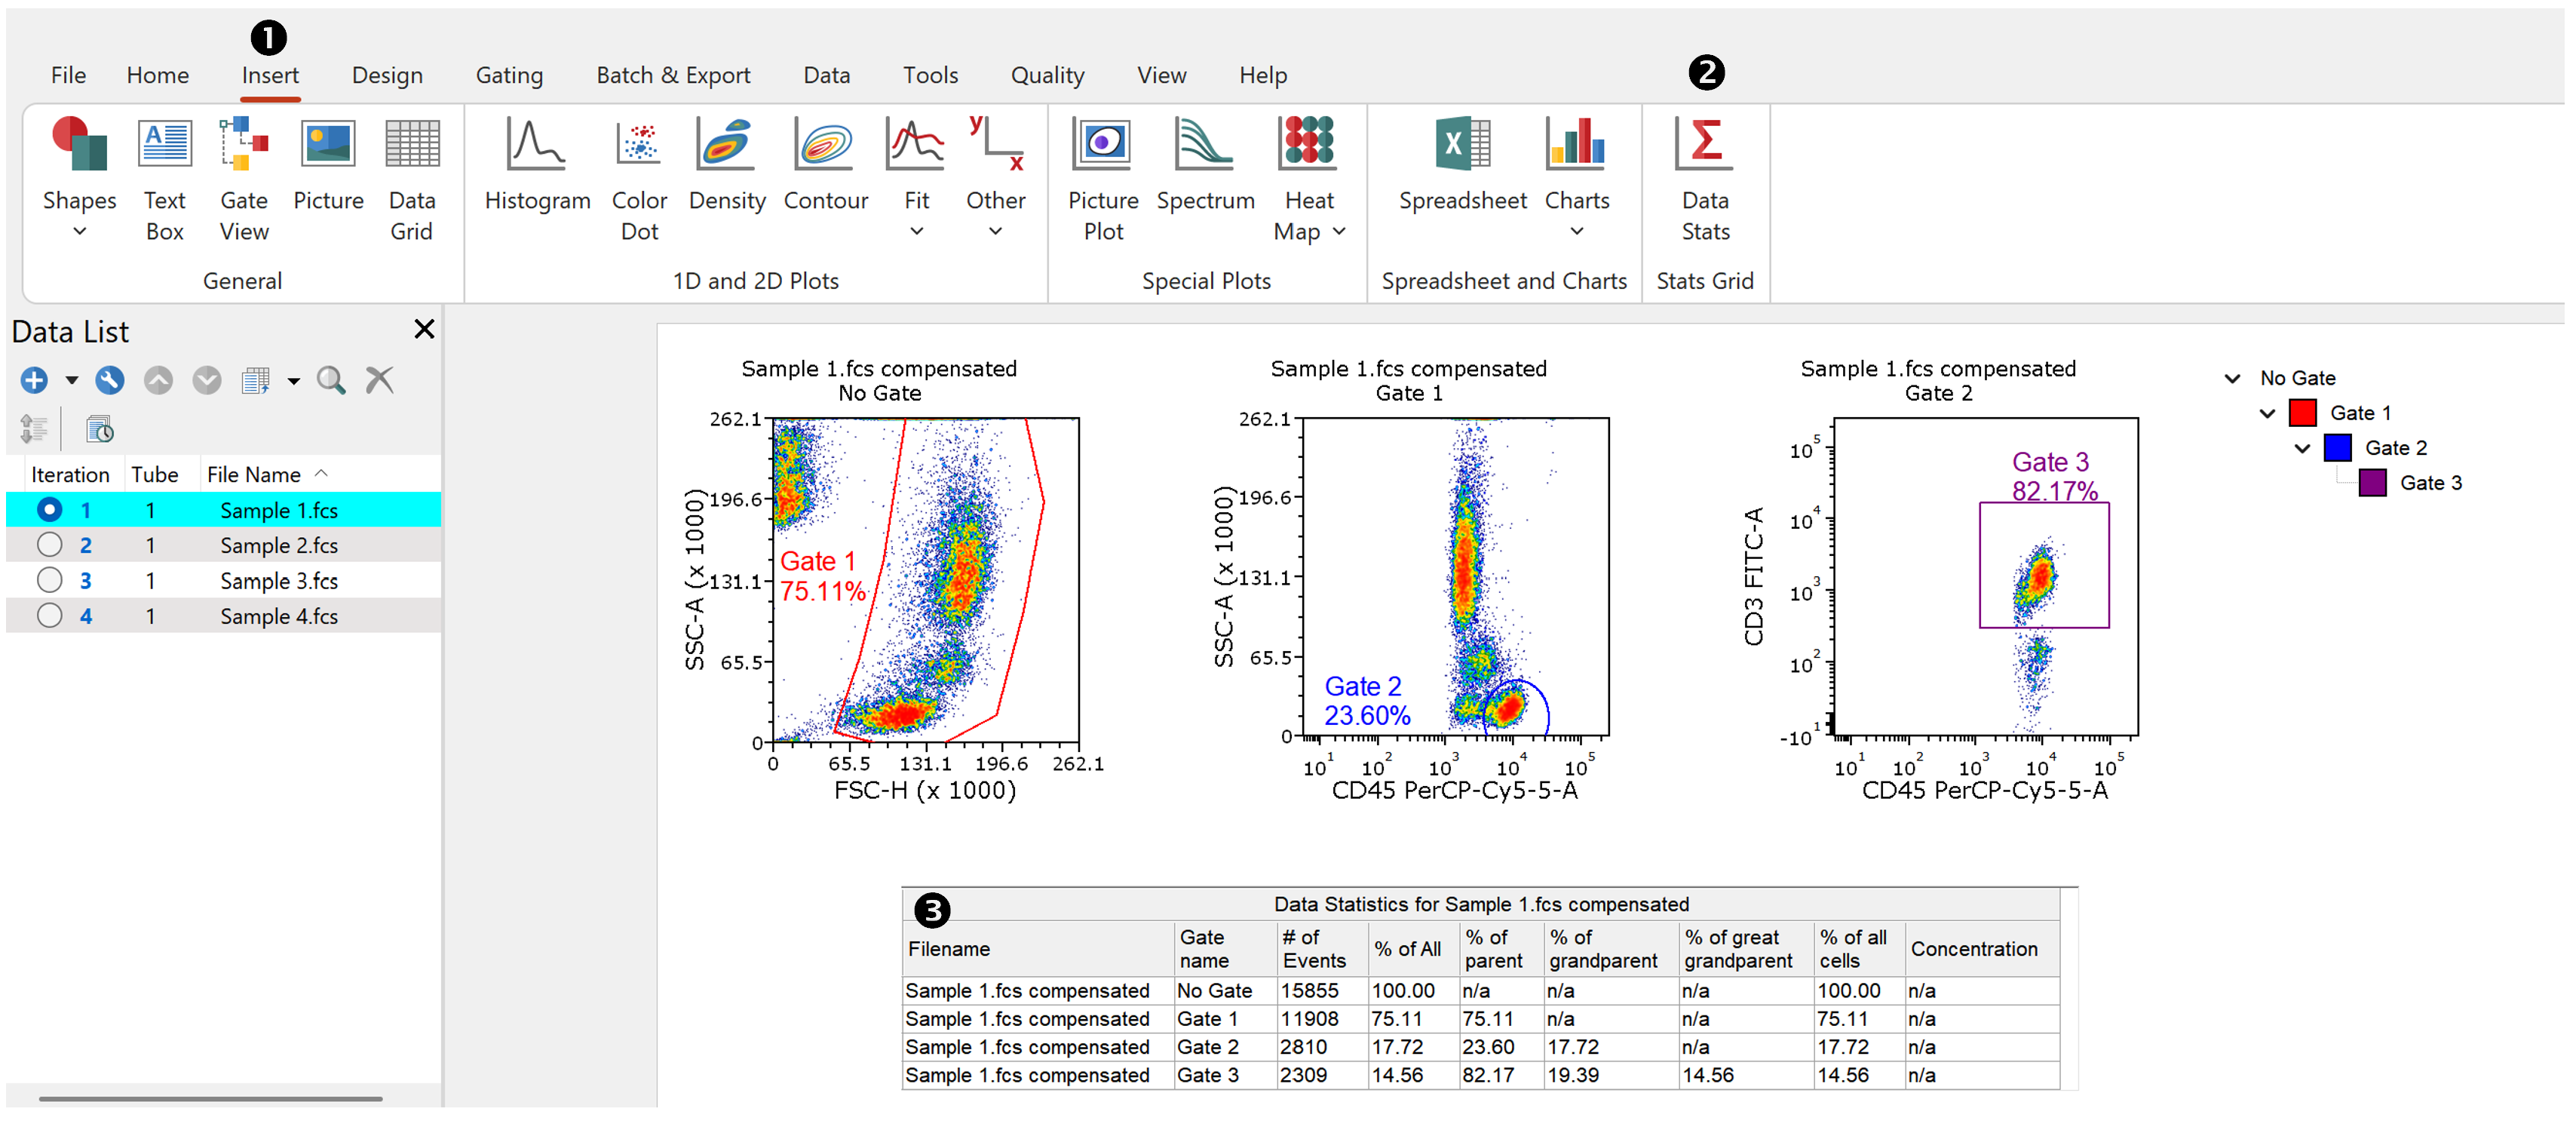
Figure 11.5 Inserting a Data Stats table via the Insert tab.
Via drag and drop from the Data List
To display a Data Stats grid via drag and drop, select the data file of interest in the Data List then drag and drop it anywhere in the layout. From the Select Plot Types window, choose Data Stats and click OK. (Figure 11.6)
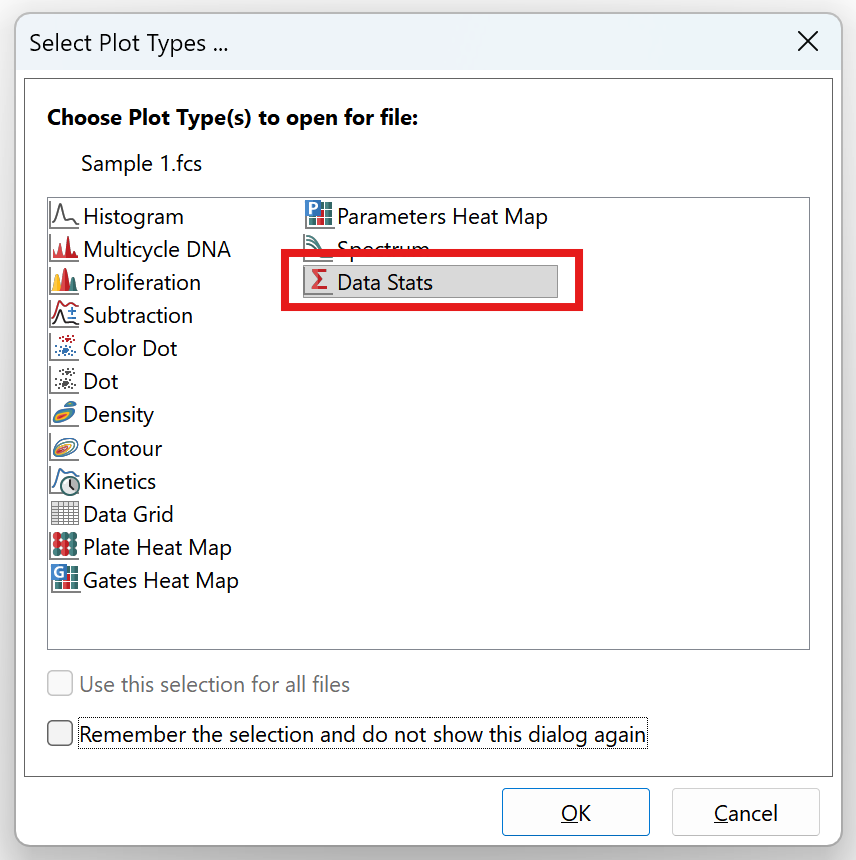
Figure 11.7 Inserting a Data Stats table via drag and drop
The title of each statistics table reports the data file from which the statistics are calculated (it can be hidden through the Statistics formatting dialog).
Note: The Data Stats grid can formatted (e.g. to show/hide different columns) by right-clicking on the grid and selecting Format from the right-click menu.
The available statistics are shown in the table below. A region can refer to a gate or quadrant.
Statistic |
Explanation |
|---|---|
Filename |
The name of the file from which the statistics are calculated. |
Gate name |
The specific region for which the statistics apply. |
# of Events |
The total number of events in the specified region. |
% of custom denominator gate |
The number of events in the specified region divided by the total number of events in the custom denominator gate defined in the 2D Stats Options dialog. |
% of parent |
The number of events in the specified region divided by the total number of events of the parent of the gate. |
% of grandparent |
The number of events in the specified region divided by the total number of events of the grandparent of the gate. |
% of great grandparent |
The number of events in the specified region divided by the total number of events of the great grandparent of the gate. |
% of all cells |
The number of events in the specified region divided by the total number of events in the FCS file. |
Concentration |
The concentration of the cells in this region. The parameters for the concentration calculation can be set up in the Concentration Calculator. Concentration is reported in Events/ml. |