Formatting Statistics Table
Any individual statistics table can be customized to control which statistics get displayed, which gate gets displayed and also how it looks (i.e. border style, size,...).
The formatting options for a Statistics table can accessed by either of these two methods:
•Right-click on the Statistics table and select Format (Figure 11.7).
•Select the Statistics table and use the Format tab

Figure 11.7 Selecting Format to change statistics to display.
The following formatting options are available:
•Statistics (see below)
•Gates To Display (see below)
•Size
•1D (or 2D) Stats Options (depending on which type of table is being formatted)
Statistics
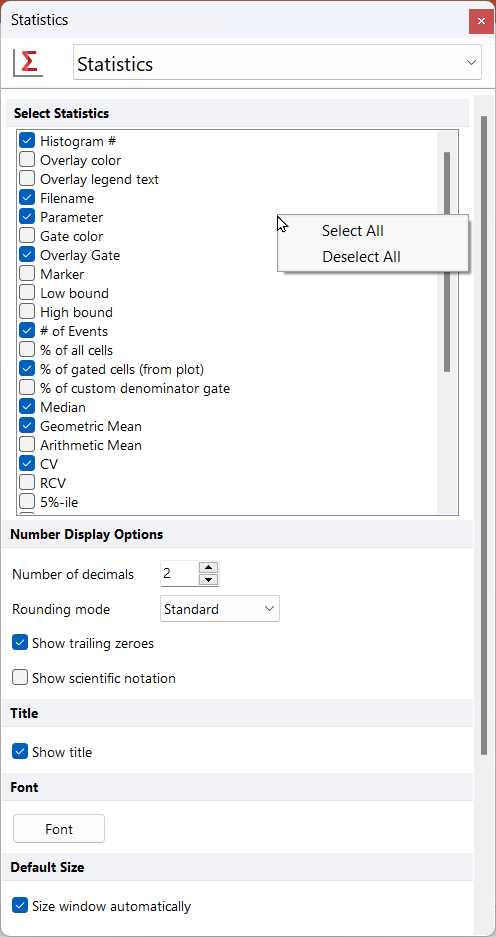
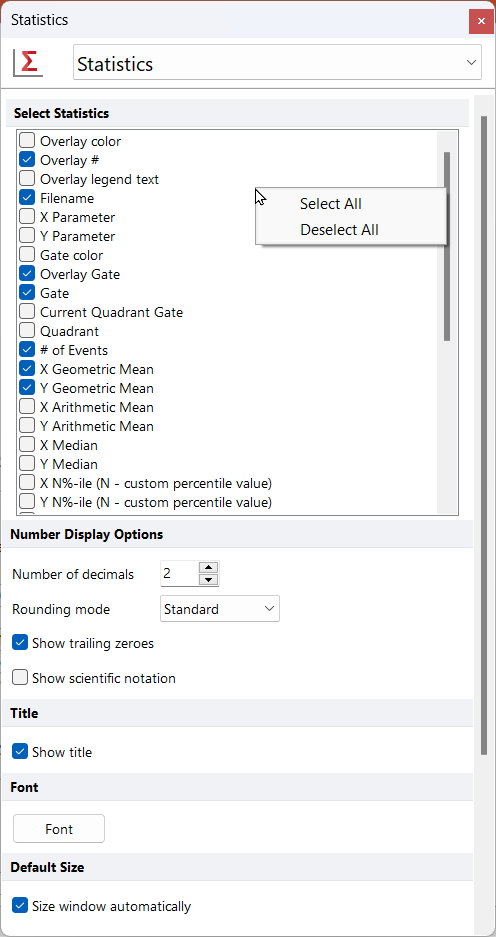
The Statistics category of the formatting options allows you to define which statistics get displayed in the selected Statistic table. Individually select/deselect each statistic you want to display by checking/unchecking the appropriate check box in the Select Statistics list. You may also Select or Deselect All by right-clicking in the Select Statistics list (Figure 11.8).

Figure 11.8 Select/Deselect All statistics for 1D Plot

Figure 11.9 Select/Deselect All statistics for 2D Plot
Note: To customize the "% of custom denominator" and the "N%-ile (N - custom value)" tokens, you will have to go to the Statistic Options → 1D Stats Options (for 1D plots) and the Statistic Options → 2D Stats Options (for 2D plots) formatting dialogs of the selected stats table.
Note: To set the default statistics that appear when you first open a statistics window, the number of decimals to display, and other statistic options, use the 1D Plot Statistics or the 2D Plot Statistics category in the User Default Options.
Gates to Display
This option is only available for Gate Statistics tables and allows to define which gate(s) you would like to see statistics for.

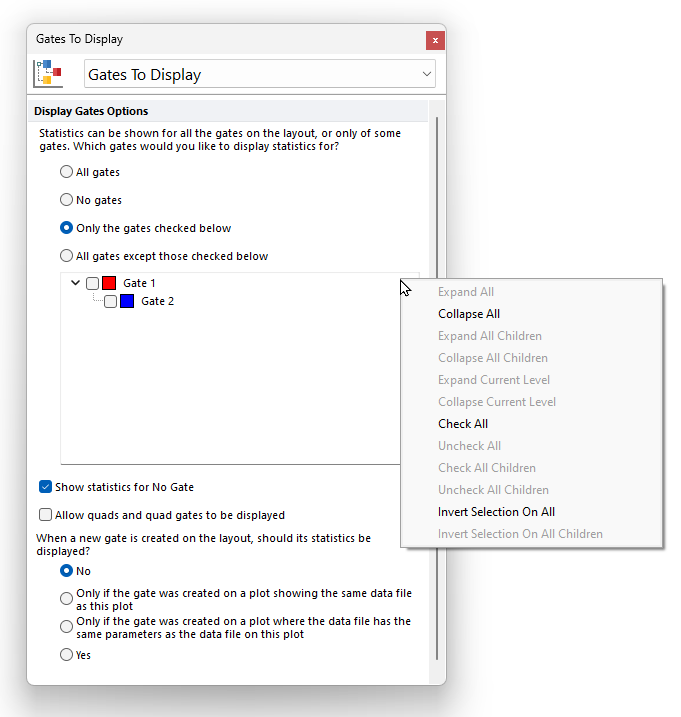
Figure 5.297 The Gate to Display formatting dialog for a Gate Statistics Tabel. A right-click menu is also avaialble.
Once the Gate to Display dialog is open, you select a gating scheme using the radio buttons among:
•No Gates (hide the Gates column) (this is the default setting)
•All gates
•Only the gates checked below and then select the gates whose colors you wish to display.
•All gates except those checked below and then choose the gates whose colors you do not wish to display.
A right-click menu is available within the Gate to Display dialog as displayed in Figure 5.299 below. The right click menu allows users to:
•Expand/Collapse All gates
•Expand/Collapse All Children gates within the selected gate
•Expand/Collapse Current Level (this expand only the first level of children gates within the selected gate)
•Check/Uncheck All gates
•Check/Uncheck All Children gates within the selected gate
•Invert Selection on All gates
•Invert Selection on All Children gates within the selected gate
Show Statistics for No Gate. Check or uncheck this option to show or hide the No Gate root gate in the Gate Navigator
Allow quads and quad gates to be displayed. Check or uncheck this option to show or hide quadrants and quadrant gates in the Gate Statistics Table.
When a new gate is created on the layout, should its statistics be displayed? This option allows to choose how to display statistics when a new gate is created on the layoutis. This option is only available when the option Only the gates checked below is checked. The No option will be the default selection. However, you can change this setting if preferred. Possible choices are:
•No
•Display the statistics Only if the new gate was created on a plot showing the same data file as this plot (as the plot where the new gate was created),
•Display the statistics Only if the new gate was created on a plot where the data file has the same parameters as the data file as this plot (as the plot where the new gate was created).
•Yes
