Analyzing and Exporting Individual Image Results with ImageJ
In this section, you will learn how to analyze and export individual image results from ImageJ using the DNSMacroExample (a set of single standalone images in a folder use case) . We will be using the macros and images from the Tutorial Sample data set→ImageJ Tutorial folder. The DNSMacroExample.ijm macro will be used along with the image found in the Single Image Analysis folder (DNAImage1.jpg and DNAImage2.jpg).
Note: This tutorial will not focus on how to create macros or use ImageJ. The focus of this tutorial will be on how to use the macros De Novo Software has provided. For more help with ImageJ, please see the ImageJ website at http://rsbweb.nih.gov/ij/index.html or write to the very helpful and informative ImageJ Mailing List.
1. Open ImageJ.
2. Install the DNSMacroExample in ImageJ.
When this macro file is installed in ImageJ (Plugins→Macros→Install), the De Novo Software Exporter button (a red rectangle with three colored circles button with the hint "De Novo Software Exporter") will be shown in the toolbar (Figure T27.13).

Figure T27.13 ImageJ Toolbar with the DNSMacroExample.ijm Macro Installed
3. Click on the De Novo Software Exporter button (Figure T27.13, indicated by cursor).
4. Open the Source drop-down list in the Images to process: window (Figure T27.14).
5. Choose From a folder option (Figure T27.14, blue highlighted text).
6.Click OK.
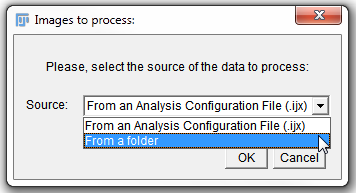
Figure T27.14 Selecting Data Sources for Images to Process
7. In Select Source Images Folder window, navigate to the DNA Experiment folder within Single Image Analysis folder for ImageJ Tutorial subfolder of the Tutorial Sample Data archive.
8. Click Select (Figure T27.15).
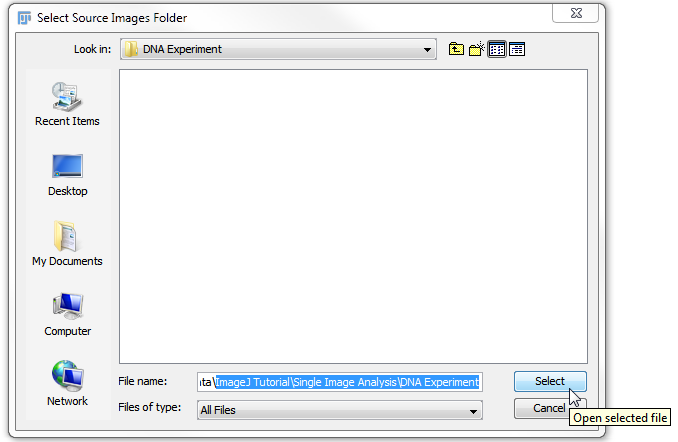
Figure T27.15 Selecting the DNA Experiment Folder
ImageJ will now automatically process all of the images within the Single Image Analysis folder. The images will be process based on the functions to customize the macro in the last lines of the macro following the text:
// - - - - - - - - - The functions below this line are the ones that the user can customize - - - - - - - - - - -
This will include thresholding and object identification/segmentation. For more information on customizing macros and adjusting settings in ImageJ please see the ImageJ website at http://rsbweb.nih.gov/ij/index.html or write to the very helpful and informative ImageJ Mailing List.
The exported .ijout files will be named DNAImage1.ijout and DNAImage2.ijout. Two folders that contain other exported information that are named according to the original file name will be present also (Figure T27.16).
Note: that the name of the .ijout file and the folder that contains the results must always be the same. Multiple segmentations, and therefore multiple .ijout and results folders may also be generated from the same images. In the case of running multiple segmentations the same set of original images may be used without duplicating the image data set.
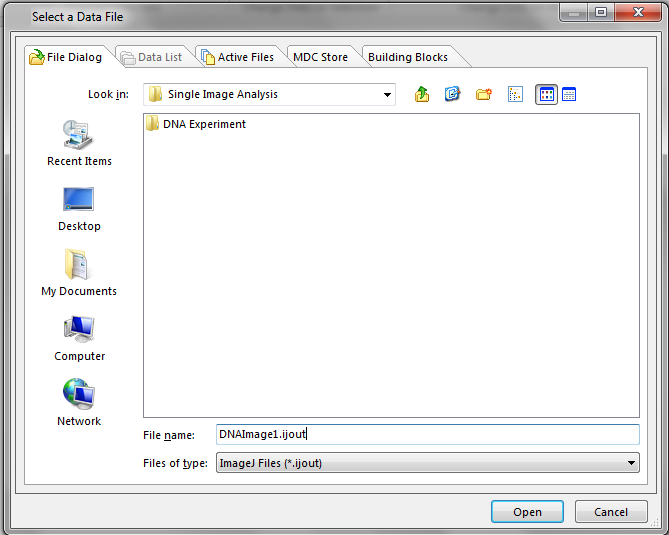
Figure T27.16 Single Image Analysis Folder after Processing Images
We now will open the exported data with FCS Express.
9. Open FCS Express.
10. Click on the Insert Tab→2D Plots→Dot.
11. Click anywhere on the layout to insert the Dot plot.
12. Choose ImageJ Files (*ijout) from the Files of type drop down menu.
13. Navigate to the Tutorial Sample Data folder→ImageJ Tutorial→Single Image Analysis folder.
14. Choose DNAImage1.ijout.
15. Click Open.
16. Click on the Insert Tab→Other Plots→Picture Plot.
17. Click anywhere on the layout to insert the picture plot.
The layout should now contain a Dot plot and Picture Plot for the data exported from ImageJ (Figure T27.17). Using the Next and Previous buttons from the Data Tab→Change Data on All Objects section will change between the data from the first and second DNA images that were processed. Please see the further resources section below for more information about working with plots and imaging data in FCS Express.
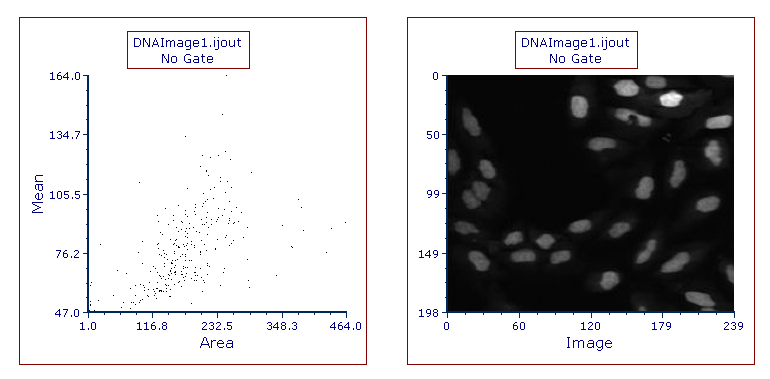
Figure T27.17 Dot and Picture Plots Displaying Data from DNAImage1.ijout
Note about panning and zooming (please refer the working with picture plots chapter for more details)
By default, Picture plots display images at their original zoom starting from their top-right corner. When the original size of the picture exceeds the size of the plot, to see a larger part of the picture the user can:
•enlarge the plot itself and/or (Figure T27.17a below)
•change the zoom of the Picture plot by selecting Specific Options from the Format tab of the ribbon bar (Figure T27.17b below). Should the zooming not being enough, the plot can be resized in addition.
If a different region of the image should be displayed within the picture plot, please change the panning (please refer the working with picture plots chapter for more details).
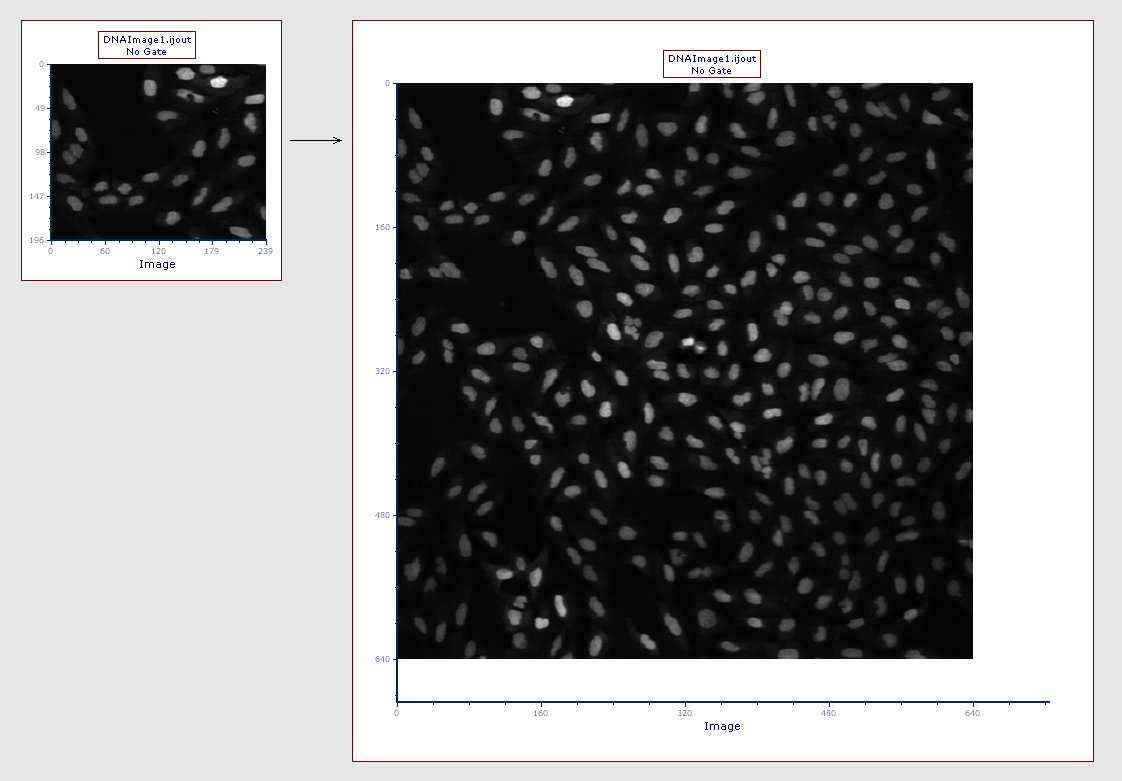
Figure T27.17a
The picture plot (left) has been resized in order to display teh full picture (right)
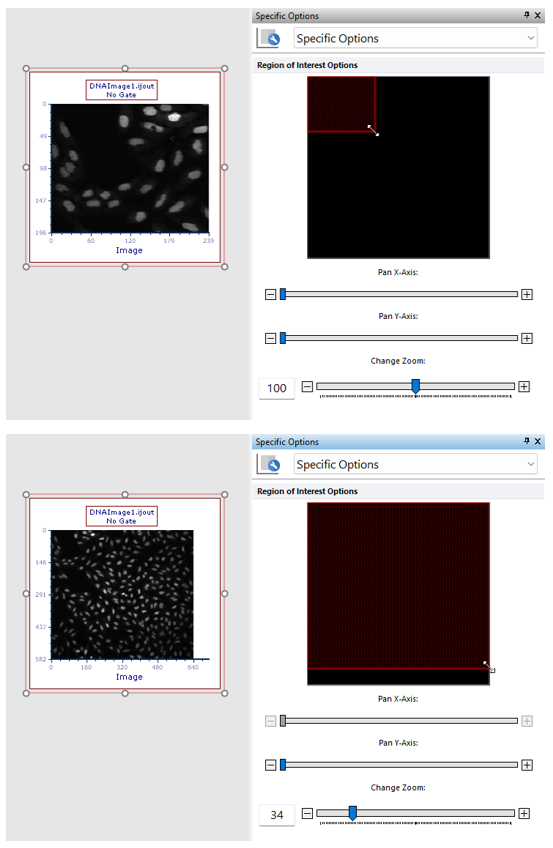
Figure T27.17b
The picture plot (top) has been zoomed through the Specific Options dialog in order to display a larger part of the picture (bottom).
Further Resources:
•Introduction to FCS Express Image Cytometry Tutorial
•ImageJ for FCS Express Knowledge Base
