Axis Scalings and Statistics

Contents
In FCS Express, all the statistics are calculated on the raw data, irrespective of the display scaling. However, when Gates and Quadrants are created decisions must be made in cases where an event falls on the line of the gate or quadrant.
In FCS Express, Gates and Quadrants are calculated and drawn in a binned space with binning dependent on both the Scaling and the Resolution Minimum/Maximum of the plot. In turn, the inclusion or exclusion of an event on the border line of a gate or in a quadrant is highly dependent on the scaling of the plot, and on the Resolution Minimum/Maximum, of the plot the Gate/Quadrants was drawn on.
When adjustments to the scaling or resolution of a plot are made, an event may then fall to a different side of the border line of the gate/quadrant, and the user may notice very slight changes in the statistics of gated events which are usually quite minimal and make no impact on the interpretation of the results.
To illustrate the scenario the example below use the exact same Quadrants which have been drawn on different plots using different Scale and/or different Resolution Minimum/Maximum values. In row 1, the three plot are using different Scales (i.e. Log, Biexponential and Hyperlog respectively) but the same Resolution Minimum/Maximum. In row 2, the three plots are using the same scale (i.e. Biexponential) but different Resolution Minimum/Maximum values. In row 3, plots are using different Scales and different Resolution Minimum/Maximum values.
Each of the plots below is using a different binning, thus, Quadrants drawn on each them, will use a slightly different binning as and very slight differences in percentages may be observed (Figure 5.142).
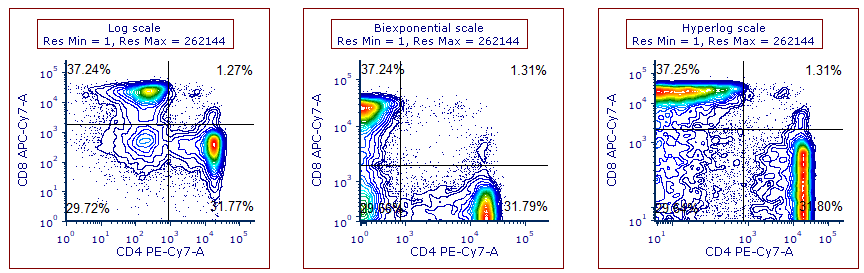
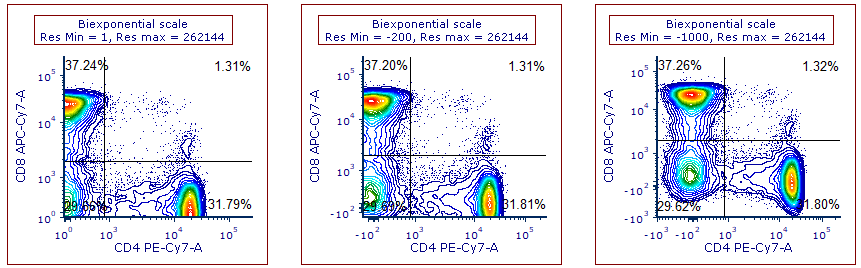
 because of the different binning on the plots and the assignment of events that fall on the borders of the quadrants.")
Figure 5.142 The same Quadrants have been displayed on plots using different axis scales and/or different Resolution Minimum/Maximum values. Quadrant statitìstics are slightly different (yet statistically insignificant) because of the different binning on the plots and the assignment of events that fall on the borders of the quadrants.
Although small differences exist for both Quadrants and Gates, they are usually only visible for quadrants since they are dependent on the scaling of the plot the quadrant is displayed on. When the axis scale changes, the Quadrant binning on that plot updates as well.
The behavior of Gates is slightly different, as Gates retain the binning of the plot they have been drawn on meaning that a gate can be displayed on plots using different scales but, for consistency, it will always refer to the binning of the plot it has been drawn on.
In the following three scenarios (Figure 5.143), the same Gate has been drawn on a plot using a specific scale (i.e. Log scale in the first row, Biexponential scale in the second row or Hyperlog scale in the third row). The gate has then been displayed on plots using different scales (i.e. Log scale in the first column, Biexponential scale in the second column or Hyperlog scale in the third column). The Resolution Minimum/Maximum on all the plots below is set to Automatic, thus it will vary between the three columns.
The gate statistics are consistent within each row, because in each row the same gate is displayed on different plots. However, small differences are visible between different rows because the gates are using three different binnings.
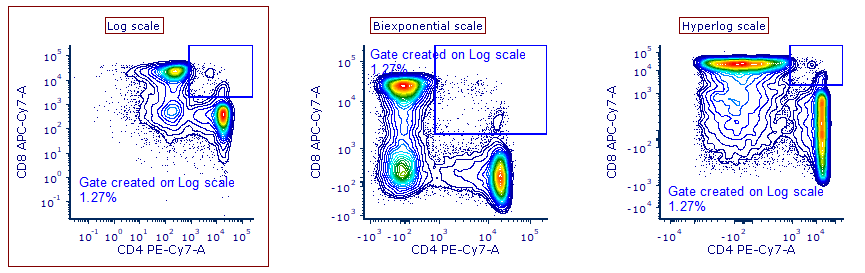
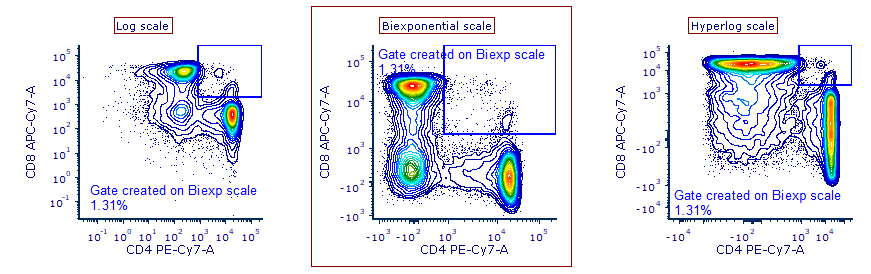
 and then displayed on plots using different axis Scales and different Resolution Minimum/Maximum (Columns 1, 2 and 3). Gate statitìstics are slightly different (yet statistically insignificant)change between rows because of the different binning. Gate statitìstics do not change between columns because Gates retain the binning of the plot thay have been drawn on.")
Figure 5.143 The same Gate has been drawn on plots using different axis Scales and different Resolution Minimum/Maximum (Rows 1, 2 and 3) and then displayed on plots using different axis Scales and different Resolution Minimum/Maximum (Columns 1, 2 and 3). Gate statitìstics are slightly different (yet statistically insignificant)change between rows because of the different binning. Gate statitìstics do not change between columns because Gates retain the binning of the plot thay have been drawn on.