Batch processing your analysis
In this final section of the tutorial, we will create Microsoft PowerPoint↑™ and Excel↑™ exports using the powerful Batch Processing function of FCS Express.
1.Select File tab→Open.
2.Open the layout Immunophenotyping Tutorial Ready for Batch Processing.fey found in the "Immunophenotyping Tutorial" folder within the Tutorial Sample Data archive.
The layout has been saved linked to the .fcs files in the same folder, and should resemble your own layout after completing the previous section of the tutorial. You may use this provided layout or your own layout to proceed to Step 3.
3.Select the Batch tab→ Batch Export to PDF, PowerPoint, Excel, Prism, ... group → Actions and reports  . The Batch Actions and Reports window will open.
4.Move the Batch Actions and Reports window to the side of the page so that your plots are visible.
5.Click Save to PowerPoint in the Add Action drop-down menu of the Batch Actions and Report window (Figure T31.39).

Figure T31.39 Batch actions window
6.In the Create Export to PowerPoint Action dialog, check the Open presentation after saving box (Figure T31.40, left, ![]() ).
).
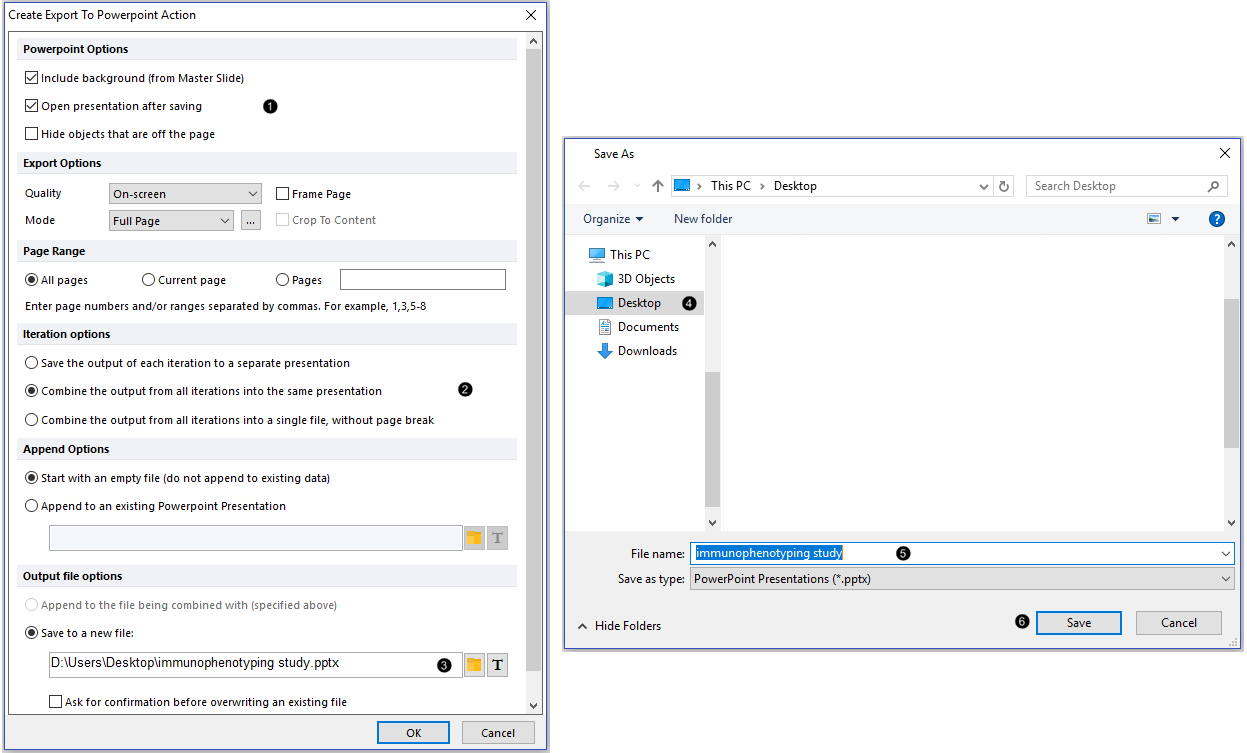
Figure T31.40 Adding a PowerPoint action to Batch Process Actions
7.Click the Combine the output from all iterations into the same presentation radio button in the Iteration options section (Figure T31.40, left, ![]() ). Note: the first radio button, if selected, would result in each sample being saved to its own .PPT file.
). Note: the first radio button, if selected, would result in each sample being saved to its own .PPT file.
8.Click on the Folder icon under Save to a new file in the Output file options section (Figure T31.40, left, ![]() ).
).
9.Navigate to the directory folder to which the exported file will be saved (e.g., Desktop), in the Save As dialog window (Figure T31.40, right, ![]() ).
).
10. Type "immunophenotyping study" in the File name field (Figure T31.40, right, ![]() ).
).
11. Click Save (Figure T31.40, right, ![]() ).
).
12. Click OK in the Create Export to PowerPoint Action dialog box (Figure T31.40, left, cursor).
13. Click on Excel → Export to Excel (Column Mode) in the Add Action drop-down menu of the Batch Actions window (Figure T31.39).
14. In the Excel (Column Mode) Options dialog, select the File Options section and click the folder icon ![]() under Save to a new file (Figure T31.41,
under Save to a new file (Figure T31.41, ![]() ).
).
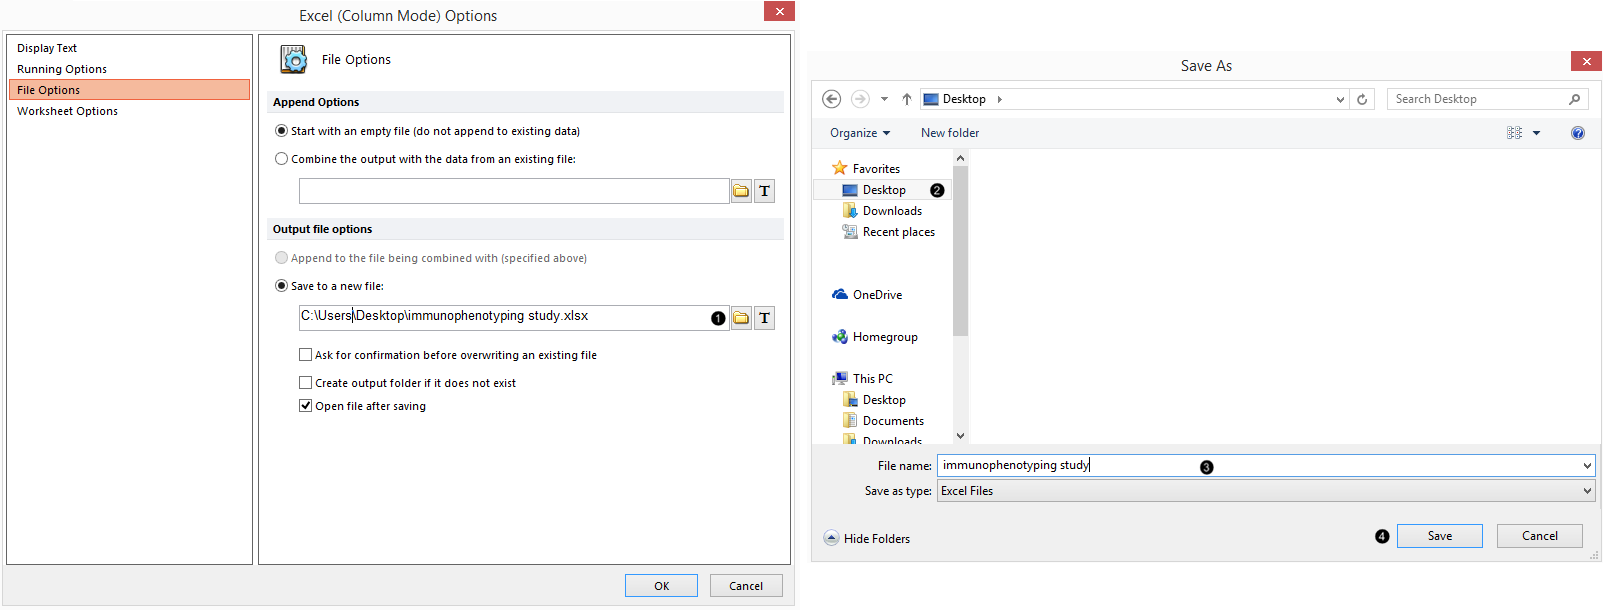
Figure T31.41 Adding an Excel (Column Mode) report to Batch Process Actions
15. Navigate to the directory folder to which the exported file will be saved, such as the Desktop, in the Save As dialog window (Figure T31.41, ![]() ).
).
16. Type "immunophenotyping study" in the File name field (Figure T31.41, ![]() ).
).
17. Click Save (Figure T31.41, ![]() ).
).
18. Click OK in the Excel (Column Mode) Options dialog box (Figure T31.41, ![]() ).
).
We now must choose which tokens to include in our Excel export.
19. Click on the text table in the lower-right corner of the layout to select it (Figure T31.42, ![]() ).
).

Figure T31.42 Dragging and Dropping a Table within a Text Box to Add Tokens to Excel (Column Mode) Export in Batch Actions
Note: the layout pictured has had the optional steps completed for adding red outlier dots to the contour plot, and for normalizing the histogram. If you are using your own layout from the previous section and skipped those steps, those two plots will look slightly different.
20. Drag the text table by the green or red outline toward the Batch Actions window, while keeping the mouse button pressed.
21. Release the mouse when the cursor is on the Excel (Column Mode) icon in the list of Batch Process Actions (Figure T31.42, ![]() ). You may notice a ghost of the table appearing in the Batch Process Actions before you release the mouse. All of the statistical tokens in the text table have now been added to the Excel (Column Mode) export (Figure T31.42,
). You may notice a ghost of the table appearing in the Batch Process Actions before you release the mouse. All of the statistical tokens in the text table have now been added to the Excel (Column Mode) export (Figure T31.42, ![]() ).
).
Note: You may also add tokens to your Excel exports by dragging and dropping plot elements, including gates, gate/marker/quadrant text boxes, and entire plots; individual tokens from default Statistics Windows and text tables may be added in the same manner as well. We will now add a Token to the report by dragging and dropping a plot.
22. Click on the upper-left plot to select it (Figure T31.43, ![]() ).
).
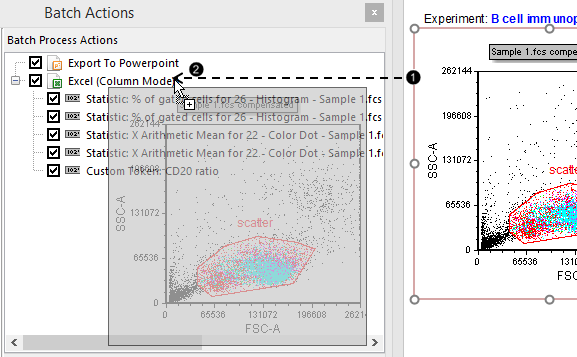
Figure T31.43 Dragging and dropping a plot-derived element into the Excel export of the Batch Process Actions window
23. Drag the plot toward the Batch Actions window, while keeping the mouse button pressed.
24. Release the mouse when the cursor is on the Excel (Column Mode) icon in the list of Batch Process Actions (Figure T31.43, ![]() ). You may notice a ghost of the plot appearing in the Batch Process Actions before you release the mouse.
). You may notice a ghost of the plot appearing in the Batch Process Actions before you release the mouse.
25. Click on Keyword Token in the Paste Special dialog box (Figure T31.44).
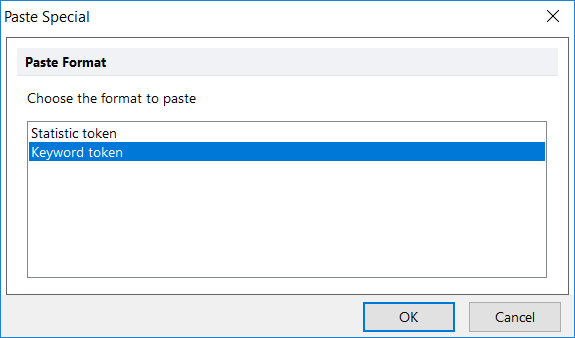
Figure T31.44 Selecting a keyword token
26. Click OK (Figure T31.44).
27. Click on the ellipsis in the Select a keyword dialog box (Figure T31.45, ![]() ).
).
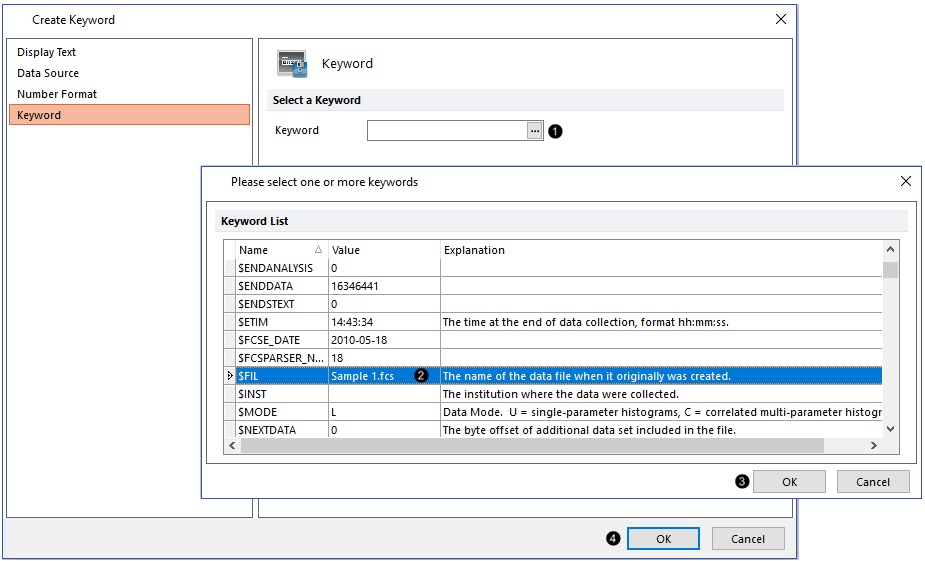
Figure T31.45 Selecting a specific keyword token
28. Scroll to and select $FIL in the Please select a keyword dialog box (Figure T31.45, ![]() ).
).
29. Click OK in the Please select a keyword dialog box (Figure T31.45, ![]() ).
).
30. Click OK in the Excel (Column Mode) field "Keyword..." dialog box (Figure T31.45, ![]() ).
).
Several statistical and keyword tokens are now ready to export to Excel. We will now reorder the list so the keyword token is exported to the first column in your Excel worksheet.
31. Press and hold on the "Keyword: $FIL for Plot#..." token (Figure T31.46, ![]() ).
).

Figure T31.46 Reordering the tokens in the list to be exported to Excel
32. Drag this token to be directly below the Excel (Column Mode) icon (Figure T31.46, ![]() ).
).
33. Release the mouse when the blue bar spanning the window width is at the position shown in Figure T31.46, ![]() . The tokens have now been re-ordered as in Figure T31.46, right. Note: if the token does not move to the new position in the list, expand the width of the Batch Process Actions window (simply by dragging its border to be wider, so there is white space beyond the end of each token descriptor) and try again.
. The tokens have now been re-ordered as in Figure T31.46, right. Note: if the token does not move to the new position in the list, expand the width of the Batch Process Actions window (simply by dragging its border to be wider, so there is white space beyond the end of each token descriptor) and try again.
Although we can Batch Process our analysis, let's first take a look at all of our samples within the layout itself. This is easily accomplished in FCS Express; there is no need to make replicate plots and tables for each of our samples. Since, in FCS Express "what you see is what you get," you could even print the layout now or add a Print action to the list of Batch Process Actions, and the printout would appear exactly as the layout does on the screen for all the samples.
34. Select the Data tab→Organize Data Sets group→Data List command ![]() . The Data List appears, which contains the four .fcs files in the directory folder from which "Sample 1.fcs" was loaded. When we run the Batch Process, there will be four iterations, and we will have four slides in our PowerPoint file and four rows of data in our Excel export.
. The Data List appears, which contains the four .fcs files in the directory folder from which "Sample 1.fcs" was loaded. When we run the Batch Process, there will be four iterations, and we will have four slides in our PowerPoint file and four rows of data in our Excel export.
Note: If you generally prefer to define a list of .fcs files to work with at the start of your analysis, you may add your files to the Data List before beginning to build your layout. In this tutorial, we simply loaded "Sample 1.fcs" into our plots and allowed the other three files in the directory folder to be added to the Data List automatically.
35. Select the Data tab→ Change Data on All Objects→ Next (Figure T31.48). Watch as each of the plots and statistics tables on your layout update to the next file every time Next is clicked. When "Sample 4.fcs" is displaying on the plots, it will no longer be possible to click Next, as it is the last file in the Data List.

Figure T31.48 Changing data on all objects to the next iteration in the Data List
36. Click on the Data tab→Change Data on All Objects →Previous (Figure T31.48, to the left of Next) until "Sample 1.fcs" is displaying on the layout again.
As you click Next to advance through your Data List, you may notice that the populations shift in position, and you may wish to adjust gates, markers, or quadrants accordingly. We will now add a pause between iterations to our Batch Options so that the software will pause before exporting the data for each sample. During this pause, we can adjust the "B cells" gate for "Sample 2.fcs" (for example), before the PowerPoint and Excel exports are generated for that sample and prior to the layout advancing to the "Sample 3.fcs" iteration. Note: you need not access Batch Options (as described in Steps 41-44 and 46-48) for batch processing FCS Express layouts in which no adjustment between iterations is required.
37. Select the Batch tab→Batch Export to PDF, PowerPoint, Excel, Prism, ... group→Options  .
.
38. Check the Unconditionally pause between iterations box in the Batch Processing Options dialog (Figure T31.50, ![]() ).
).
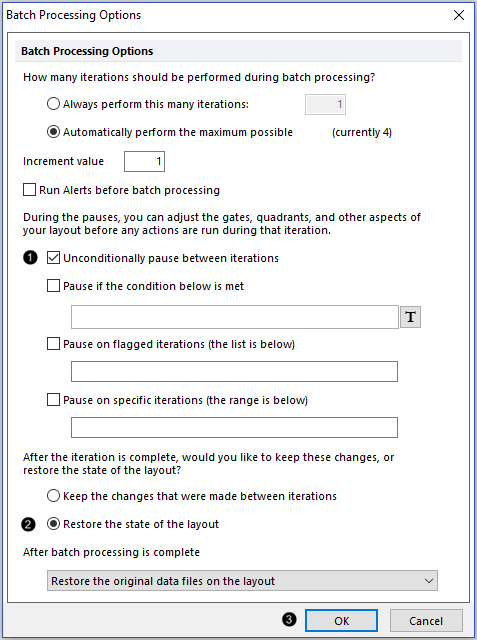
Figure T31.50 Adding a pause between iterations to our batch process
39. Click the Restore the state of the layout radio button (Figure T31.50, ![]() ).
).
40. Click OK (Figure T31.50, ![]() ).
).
41. Select the Batch tab → Batch Export to PDF, PowerPoint, Excel, Prism, ... group → Run ![]() .
.
The Batch Processing status window appears (Figure T31.52), indicating that 2 of 2 actions (i.e., one PowerPoint slide + one Excel row of statistics) have been completed for 1 of 4 iterations in the Data List.
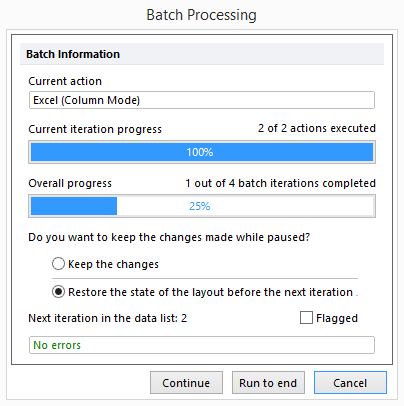
Figure T31.52 Status of the batch process (currently in progress)
42. Adjust the "B cells" gate, quadrants on the contour plot, and/or the marker "M1", if desired. You may also make other changes to your layout during this pause, such as rescaling plot axes, or reformatting, adding, or deleting plots, text boxes, or any other object.
43. Click Continue (at the bottom of the window pictured in Figure T31.52).
44. Repeat Steps 42-43 until the end of the Batch Process; alternatively, click Run to End (at the bottom of the window pictured in Figure T31.52) if no more changes need be made.
45. Examine your PowerPoint export, noting that each of the four slides looks exactly like your layout in FCS Express in which you performed your analysis, and that the adjustments made to gates, markers, and quadrants are recorded in the slides. Each plot and statistics window on the slide is exported as a high-resolution object which can be moved and re-sized as you wish.
Note about ungrouping objects in PowerPoint for PC versus PowerPoint for Mac
Once exported to PowerPoint, layout objects can be further ungrouped into single components in the PC version of Microsoft PowerPoint. Ungrouping objects saved by FCS Express in PowerPoint for Mac is not supported. However, presentations saved on a Mac may be opened on a PC and ungrouped. Note: an example PowerPoint export of this layout is saved in the "Immunophenotyping Tutorial" folder within the Tutorial Sample Data archive.
46. Examine your Excel export and note that the exported statistics for each of the four samples reflect the adjustments made to gates, markers, and quadrants which were recorded in the PowerPoint export. Note: an example Excel export of this layout is saved in the "Immunophenotyping Tutorial" folder within the Tutorial Sample Data archive.
View the Immunophenotyping Analysis recorded webinar accompanying this tutorial.
