Working with Custom Tokens and Formula References in spreadsheets
In this section, we will:
•Creating a custom token and insert it in a spreadsheet.
•Learn how to use spreadsheet formulas to replace custom token formulas. (Jump to this section)
We will begin by using the HLA Spreadsheet.fey layout found in the Tutorial Sample Data archive folder.
The layout contains plots and statistics related to an HLA cross matching data set. In this tutorial we will first learn how to create a custom token formula and insert the result in a spreadsheet. We will then learn how to use spreadsheets to create the formula in spreadsheet cells to contrast the two different methods for calculating custom statistics in FCS Express. Using spreadsheets for custom calculations (rather than custom tokens) allows for quick access to additional chart types for the data sets of interest and may also be more efficient for calculating certain formulas. For instance, with the particular data set we are using it would take an additional amount of effort to create the necessary custom token formula(s) whereas using a spreadsheet allows you to quickly copy and paste cells to derive statistics and use the copy down feature to calculate formulas for multiple cells.
To begin, we will first complete a series of custom tokens that normalize a 'samples' median fluorescence values based on a 'negative' value. We will use the median MESF FITC values from the B cells of the PBS NEGATIVE CONTROL as the 'negative' value and subtract this value from the median MESF FITC value of the corresponding samples. We will begin by inserting the Custom Tokens window.
1. Select File tab→Open.
2. Load the HLA Spreadsheet.fey layout from the Tutorial Sample Data archive.
The layout will appear with the Custom Tokens window docked on the left side of the layout. For more information on docking, please see the Docking tutorial.
Three custom tokens used to calculate the shift in median fluorescent values between a negative control and a corresponding sample are already created in the Custom Token window as seen in Figure T16.17. We will create a final custom token that represents the MESF channel shift of a "patient" sample relative to the PBS NEGATIVE CONTROL sample. Then, the custom token will be placed into a spreadsheet table. The following steps serve as an example of how to create and use a custom token formula in a spreadsheet. Later in the tutorial, we will examine how to define this formula only using a spreadsheet.
Note: For more information on creating custom tokens, refer to the Custom Token Tutorial.
3. Click on the ![]() symbol on the top border of the Custom Tokens window.
symbol on the top border of the Custom Tokens window.
4.Type "BShift Patient" for the Custom Token name.
5.Click in the empty field of the Custom Token window under Enter the Custom Token formula below.
6.Type "=" in this Custom Token definition area.
7.Right-click to the right of the "=" sign.
8.Choose Insert Token.
9.Double-click the Statistic category.
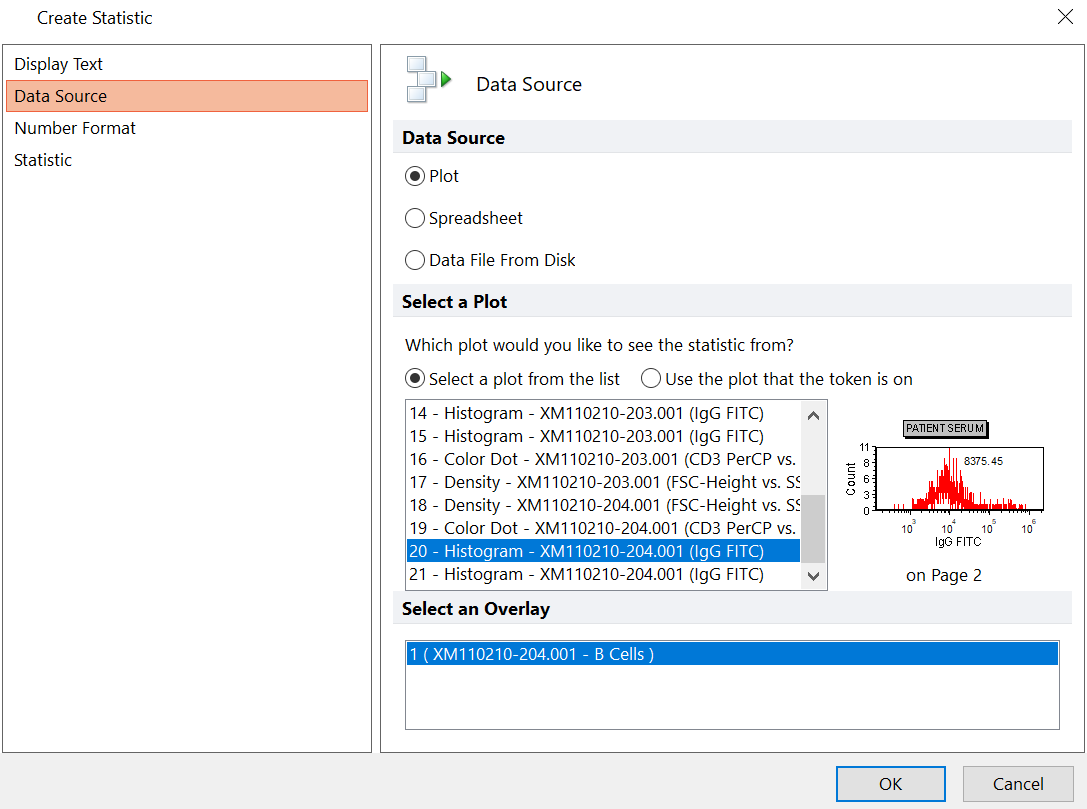
10. Choose 20-Histogram XM110210-210.001 (IgG FITC) in the Select a Plot dialog, as in Figure T16.18.

Figure 16.18 Create Statistic Dialog - Defining Data Source
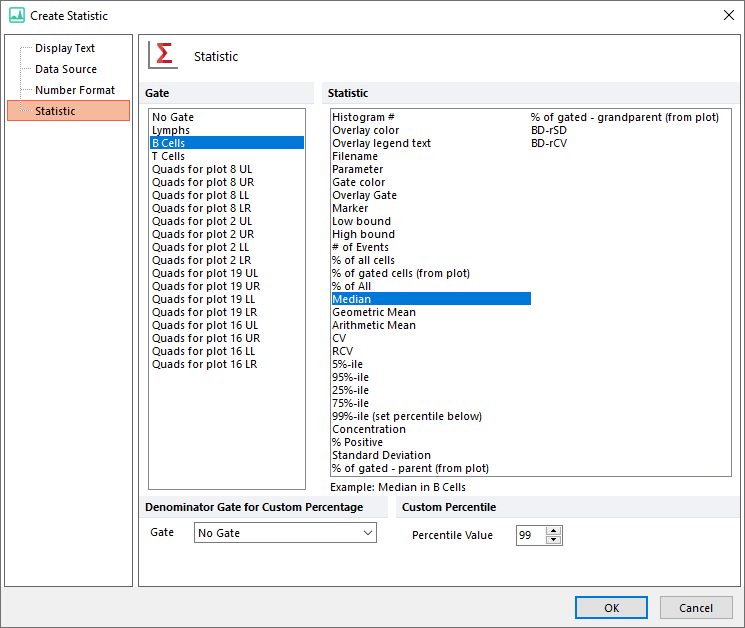
11. Click on the Statistic category, orange highlight in Figure T16.18.
12. Choose the B Cells gate from the Gate area.
13. Click on Median under Statistic.
The Create Statistic dialog should resemble Figure 16.19.

Figure 16.19 Creating Statistic Dialog - Selecting Statistic
--
Note: the order the gates are displayed in the create statistic dialog was changed in version 7.20 onwards. Now, all shown gates (i.e. those whose outline is displayed on the plot of interest) are set to be on top of the list.
--
14. Click OK.
The median token value will appear in the custom token definition.
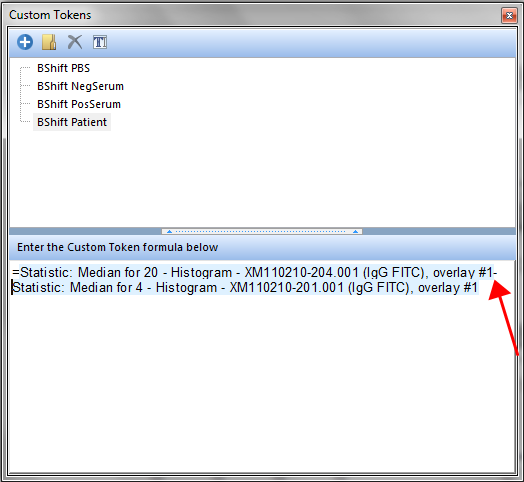
We now will complete the complete the BShift Patient custom token, shown in Figure T16.20.
15. Type '-' after the token defined in the previous steps (Figure T16.20, red arrow).
16.Repeat steps 8-15 after the minus sign choosing 4-Histogram XM110210-210.001 (IgG FITC) instead of 20-Histogram XM110210-210.001 (IgG FITC).
The Custom Token formula will appear as in Figure 15.26 below. Notice the custom token formula is defined as the median for plot 20 minus the median for plot 4.

Figure T16.20 Creating the B-cell Median Shift Custom Token Definition
We now will populate cell B4 with the respective cell shift custom token in the spreadsheet on Page 3 by dragging and dropping the BShift Patient Custom Token into the spreadsheet.
17.Click on the Page 3 page tab.
18. Click and hold the BShift Patient Custom Token, shown highlighted in blue (Figure T16.21, left panel).
19. Drag the BShift Patient Custom Token to cell B4 in the spreadsheet.
20. Release the mouse button when the cursor is over cell B4 in the spreadsheet, (indicated by the cursor and the red arrow in Figure T16.21).

Figure T16.21 Dragging and Dropping the "BShift Patient" Custom Token into the Spreadsheet.
The spreadsheet now should resemble Figure T16.22.

Figure T16.22 Spreadsheet with BShift Custom Tokens in Column B
We will now complete a series of custom tokens for corresponding T cell median fluorescent shift values by using tokens and formulas in the spreadsheet. The method described below will contrast the method of using custom tokens. The TShift Negative Control Tokens that we will bring into Column 'D', will be subtracted from the TShift Median Tokens in Column 'C'. The result will be returned from a formula Column 'E' which can serve to replace a series of custom token values such as the previous way we defined the BShift custom token series in the steps above.
Let's start with Dragging and Dropping the Histogram from the Data Navigator to Column 'C'. First Open up the Data Navigator. We have more information about the Data Navigator in our Tutorials and Manuals.
21. Click on the View tab→Navigators group→Data Navigator.
22. Expand the XM110210-201.001 node (first listed).
23. Click 5-Histogram-XM110210-201.001 (IgG FITC) in Data Navigator and click Page 3 tab.
24. Drag and drop 5-Histogram-XM110210-201.001 (IgG FITC) to cell C1 (Figure T16.23).

Figure T16.23 Drag and Drop to Add Statistic Token to Spreadsheet Cell
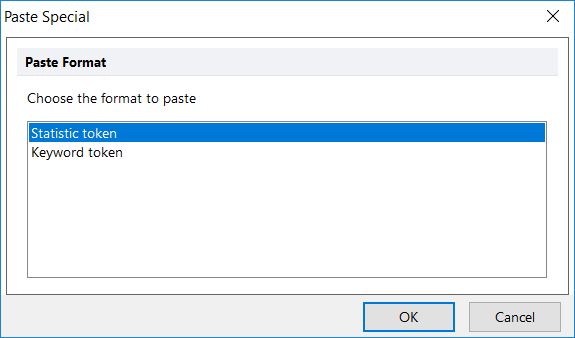
A Paste Special Dialog will appear.
25. Click on Statistic Token in the Paste Special as in Figure T16.24 below.

Figure T16.24 Paste Special Dialog
26. Select the T Cells gate from the Gate area.
27. Select Median from the Statistic list.
28. Click OK.
We will repeat the steps above to insert the rest of the TShift Median values by dragging and dropping the histograms from the Data Navigator to cells C2, C3, and C4, respectively.
29. Expand the XM110210-202.001 node in the Data Navigator.
30. Drag and Drop 6-Histogram-XM110210-201.001 (IgG FITC) to cell C2 and repeat steps 24-30.
31. Expand the XM110210-203.001 node in the Data Navigator.
32. Drag and Drop 14-Histogram-XM110210-201.001 (IgG FITC) to cell C3 and repeat steps 24-30.
33. Expand the XM110210-204.001 node in the Data Navigator.
34. Drag and Drop 21-Histogram-XM110210-201.001 (IgG FITC) to cell C4 and repeat steps 24-30.
We now will use copy and paste to copy the baseline TShift Negative Control value to the corresponding cells in Column D. The value will be subtracted from the Column C median values in a subsequent formula resulting in the TShift series of values within Column E of the Spreadsheet.
35. Click cell C1 to select it.
36. Press Ctrl+C to Copy cell C1. Alternatively, right-click and choose Copy as in Figure T16.25.

Figure T16.25 Using Copy Command to Copy Cells of Spreadsheet
37. Multiple-select cells D1-D4 by clicking and holding mouse button with cursor over cell D1 and move cursor down to D4 while holding mouse button.
38. Press Ctrl+V to Paste to cells D1-D4.
The spreadsheet should resemble Figure T16.26.

Figure T16.26 Using Multiple Select and Paste Commands in Spreadsheet
We now will complete the spreadsheet by defining the formula of the TShift series in column in E using a spreadsheet formula reference and using the copy down feature to quickly complete the formula for all rows.
39. Click cell E1.
40. Enter an "=" sign.
41. Click on cell C1.
42. Enter a "-" sign.
43. Click on cell D1.
The formula should be identical to Figure T16.27
44. Press Enter. The formula for C1 minus D1 will result in the value of 0 in cell E1.

Figure T16.27 Defining Formula in Spreadsheet
We now will use the copy down feature to quickly copy the formula down to through the remaining cells and complete the spreadsheet.
45. Click cell E1.
46. Click and drag small blue square in lower right corner of cell outline down to cell D4. The formula will be copied down the range of cells selected.
The spreadsheet should appear as Figure T16.28.

Figure T16.28 Spreadsheet Complete
Next, we will create and use token classifiers in the spreadsheet for IVD use.
