Defining a k-means cluster analysis
k-means cluster analysis is performed in FCS Express through the Transformation button within the Tools tab→ Transformations. The steps below outline the process of creating a new k-means cluster analysis on your data.
1. Open the Transformation window by selecting the Tools tab→Transformations →Transformations command  . The Transformations window will open (Figure 9.102).
2. Click on the drop down arrow adjacent to the blue plus ![]() button (Figure below).
button (Figure below).
3. Click on Kmeans in the drop down list (Figure below).

Figure 9.101 - A Kmeans transformation can be created via the Transformations navigator.
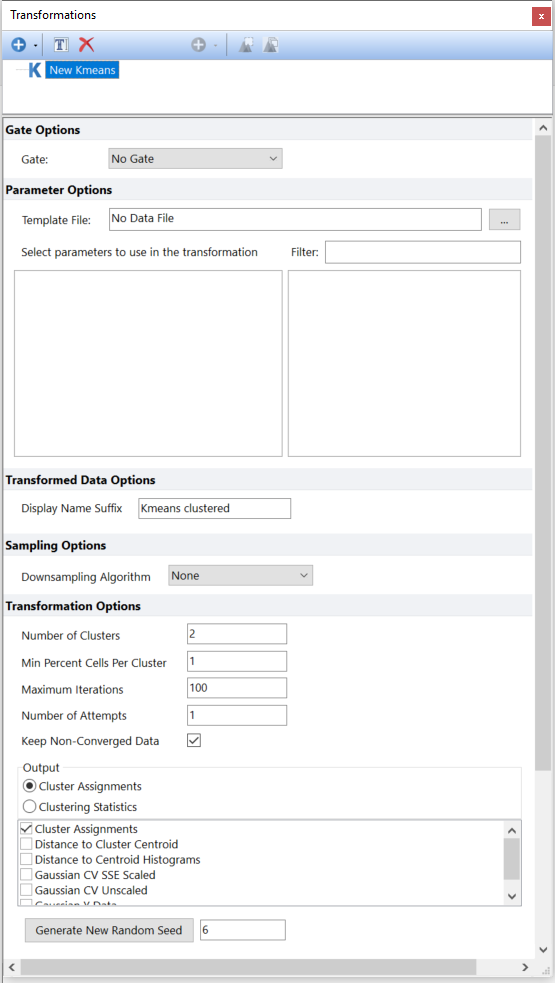
The Kmeans dialog will now appear in the Transformation window as seen in Figure 9.103.

Figure 9.102 - The Kmeans dialog opens when a new k-means transformation is created.
The new Kmeans transformation is named as New Kmeans by default and it can be easily renamed by either of the following methods:
•Right click on the Kmeans transformation that needs to be renamed→Select Rename.
•Select the Kmeans transformation that need to be renamed via left click and press F2 on your keyboard.
•Select the Kmeans transformation that need to be renamed via left click and click on the ![]() button in the Transformations tool bar.
button in the Transformations tool bar.
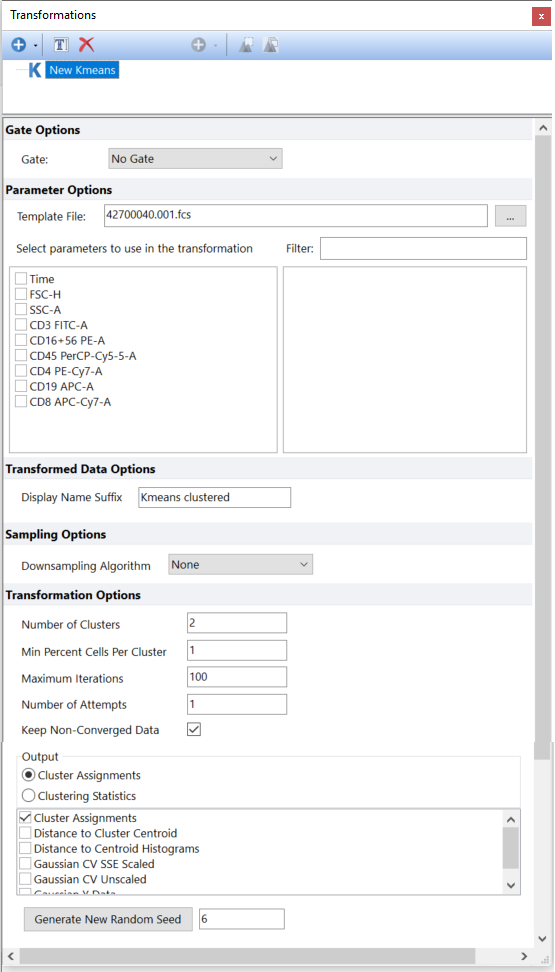
4. Choose a Template File for the k-means clustering by clicking on the ellipsis to the right of the Template File edit box.
Once the file of interest has been selected, the dialog will be populated with a list of available parameters to perform a k-means clustering based on available parameters from the template file (Figure 9.104).

Figure 9.103 - A template file has been loaded into the New Kmeans dialog.
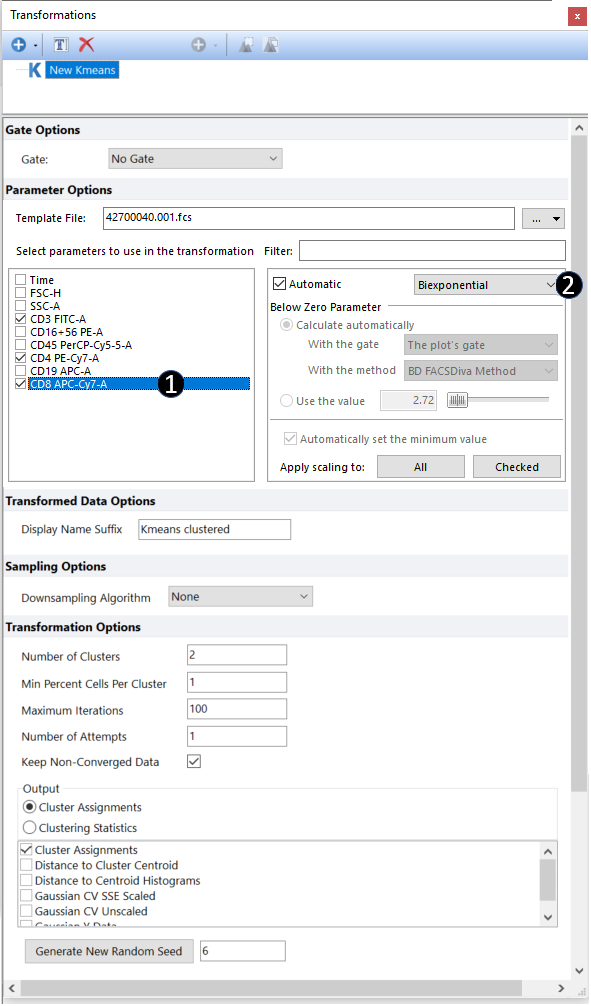
5.Choose the parameters to define the Kmeans clustering by checking the boxes next to the parameter names (Figure 9.105, Step 1). Parameters can be filtered or sorted to assist in the selection of parameters when multiple parameters are available in the template file. By right clicking in the parameters section, you can use Sort Ascending, Sort Descending, or Unsorted to easily manage parameter ordering and facilitate parameter selection. In the right click menu, you can easily select parameters by utilizing Check All, Uncheck All, Check Selected, Uncheck Selected, Invert Selection on All. The options Check Selected and Uncheck Selected allow for using the shift key or Ctrl key to multi-select parameters and check or uncheck them all simultaneously.
6.Choose or change to the appropriate Parameter Scaling Options for each of the selected parameters if required (Figure below, Step 2). By using the Apply scaling to button All or Checked the user can define the parameters to be scaled.

Figure 9.104 - Choosing the parameters to perform k-means cluster analysis.
7. A number of options can be set at this point:
Options |
Description |
Gate |
Allows the user to run k-Means only on the events within a specific gate. |
Transformed Data Options |
The user can customize the Display Name Suffix for the k-means transformation by entering information into the adjacent text box. This modifies what is displayed on a plot when the transformation is applied. |
Sampling Options |
Although multiple Sampling Methods are available (please refer to the Sampling Options chapter for more details), the default Downsampling Algorithm for k-Means is None, thus all available events (i.e. the ones defined with the Gate drop-down menu, see above) will be used. |
Number of Clusters |
It defines the number of clusters the events should be clustered by. It's equivalent to the number of centroids. |
Min percent Cells Per Cluster |
If in any iteration but the last one, a cluster contain less than this amount of cells, that centroid is dropped and it's replaced with a different cells from the dataset. |
Maximum Iterations |
This value indicate the maximum number of iterations that FCS Express should perform before quitting the clustering process. |
Number of Attempts |
This is the number of the initial set of centroids that should be tested. |
Keep-Non-Converged Data |
This option defines whether or not results obtained when the clustering does not converge should be displayed. |
Output |
Style for Kmeans clustering. See below |
The available choices are Clustering Assignments and Clustering Statistics. Please see the detailed list below explaining each option.
•Clustering Assignments: By selecting this output style, the following statistics can be assigned to each event the cluster has been performed on:
oCluster Assignment: An internal label indicating the cluster membership is automatically assigned to each event. This label is internally used by FCS Express for heatmap representation of clusters but it is also accessible through a Data grid.
oDistance to Cluster Centroid: The distance of a given event to the centroid of its cluster. Values are plotted as unique histogram.
oDistance to centroid Histograms: The same as the Distance to Cluster Centroid but in this case values are grouped, and thus plotted, separately for each cluster. Clusters are numbered from 1 to Number of Clusters.
oGaussian CV SSE Scaled: In this representation each event is plotted based on its cluster membership, thus clusters appear as separated histograms. Given that cluster membership is an integer value that goes from 1 to Number of Clusters, an artificial noise is introduced to spread out the data. Gaussian SSE scaled means that the standard deviation of the Gaussian (normal distribution) used to represent each cluster is proportional to the Sum of Squared Error of the cluster.
oGaussian CV Unscaled: In this representation each event is plotted based on its cluster membership, thus clusters appear as separated histograms. Given that cluster membership is an integer value that goes from 1 to Number of Clusters, an artificial noise is introduced to spread out the data. Gaussian CV unscaled means that the standard deviation of the Gaussian (normal distribution) used to represent each cluster is the same among clusters.
oGaussian Y Data: Events are plotted following a Gaussian (normal distribution).
•Clustering Statistic: By selecting this output style, the following statistics will be accessible through plots and Data grid:
oKmeans Cluster ID: An integer value that goes from 0 to Number of Clusters-1.
oCentroid coordinates: The coordinates of each centroid are given for each of the parameters considered for the clustering.
oSum Of Square (WCSS): The Within-Cluster Sum of Squares is reported for each cluster.
The following table lists the objects suitable for displaying each output style:
|
Can be displayed as |
|||
Heatmap |
1D or 2D plots |
Data grid |
||
Clustering Assignments |
Cluster Assignment |
Y |
|
Y |
Distance to Cluster Centroid |
|
Y |
Y |
|
Distance to Centroid Histograms |
|
Y |
Y |
|
Gaussian CV SSe Scaled |
|
Y |
Y |
|
Gaussian CV Unscaled |
|
Y |
Y |
|
Gaussian Y Data |
|
Y |
Y |
|
Clustering Statistics |
|
|
Y |
Y |
8. The k-means clustering has now been defined and automatically calculated. k-means clustering can now be applied to plots for display and analysis. (see Applying a k-means Cluster Analysis).
