Applying a k-means cluster analysis
Once k-means clustering has been performed, results can be accessed as 1D plots, 2D plots, Heatmaps and Data Grid depending on the selected output style (see the previous section). The Cluster Assignments chosen to be calculated may be accessed on plots on which the transformation has been applied as new parameters.
Although clustering results are automatically displayed when inserting a Data grid, to access clustering results as parameters in 1D plots, 2D plots and/or Heatmaps, the k-means transformation must be applied to the plots.
k-means clustering may be applied to 1D plots, 2D plots and heatmaps by any of the following methods:
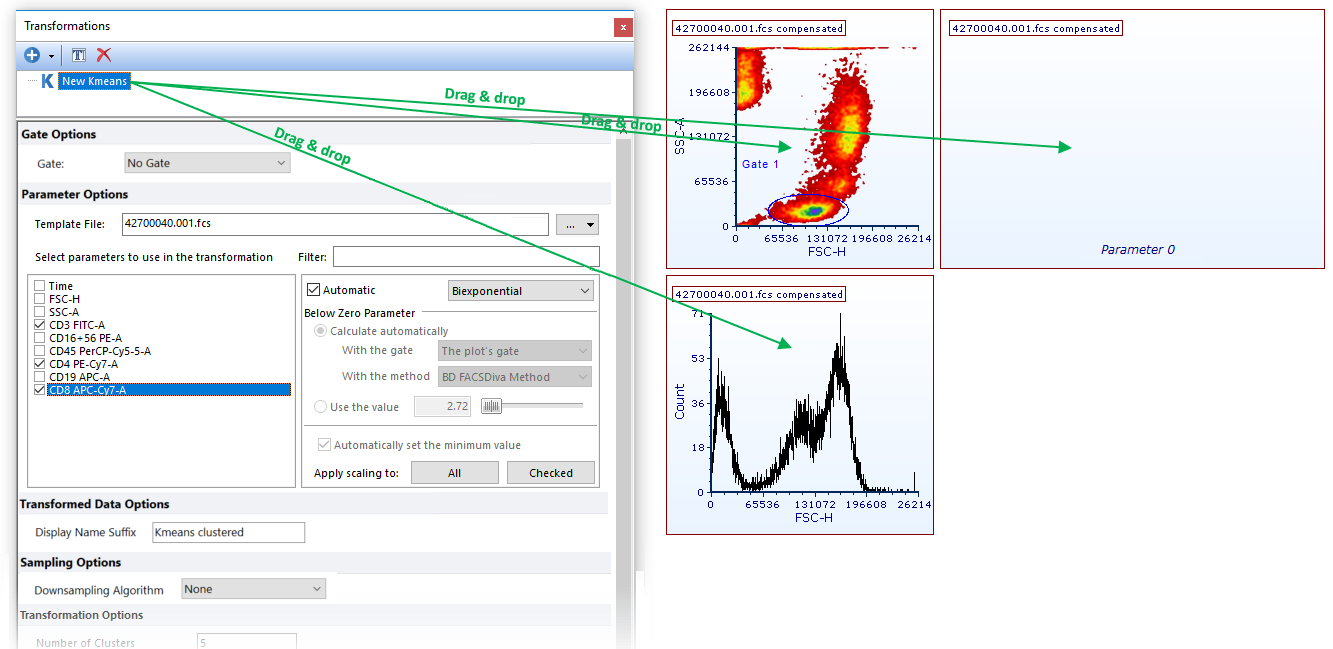
Drag and Drop (Figure 9.106)
1. Left click and hold on k-means clustering from the Transformations window.
2. Drag the Kmeans to the intended plot.
3. Release the mouse button.
The Kmeans will be applied to the plot and the title of the plot will now include the text "Kmeans clustered" to indicate the transformation has been applied.

Figure 9.105 Applying a k-means transformation to a plot by dragging the k-means transformation from the Transformation navigator to the plot (green arrows).
Using Transformations Window Commands:
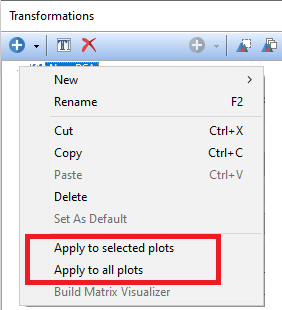
•Kmeans may be applied to individual or multiple plots by performing either option outlined in red in the Transformations window below (Figure 9.107).

Figure 9.106 Commands to Apply Transformation to Plot(s)
•Right-click the name of the parameter math in the Transformations window and click Apply to selected plot or Apply to all plots button in pop up menu (Figure 9.108).

Figure 9.107 Commands to Apply Transformation to Plot(s)
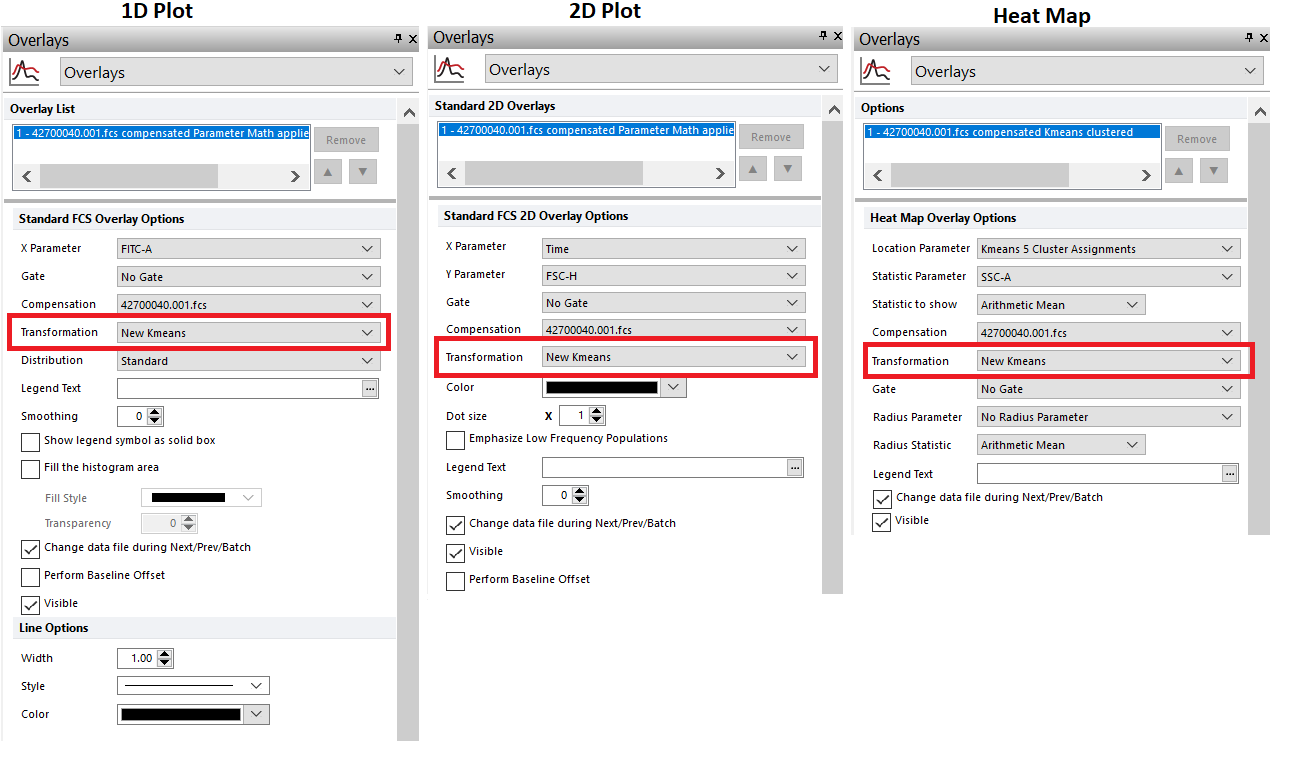
Using the Formatting Dialog (Figure 9.109)
1. Access the Overlays formatting dialog (for 1D plots, 2D plots and Heat map) or the Formatting→General dialog (for Data Grids).
2. Choose the Kmeans to apply from the Transformation drop down.
3. Click OK.

Figure 9.108 Applying a k-means transformation to a plot by selecting the k-means transformation from the Formatting Overlays dialog in the Transformation dropdown.
The result of both the previous methods is represented in Figure 9.110 below. When a k-means clustering has been applied to a plot or to an heatmap, the suffix "Kmeans clustered" will appear in the object title.

Figure 9.109 The plot title contains "Kmeans clustered" suffix when a Kmeans transformation is applied.
In the next section we will see how to work with clustering parameters.
