Defining a k-means clustering
For this tutorial, we will be using a layout file that has 2D density plots with a defined gate. The layout contain a single FCS data file obtained from Peripheral Blood stained for different surface markers. The sample has two physical parameters (FSC-H and SSC-A) and six fluorescence parameters.
To open the layout
1.Select the File tab→Open.
2.Navigate to the Tutorial Sample Data folder and open the Defining k-means.fey layout stored in the k-means tutorial subfolder.
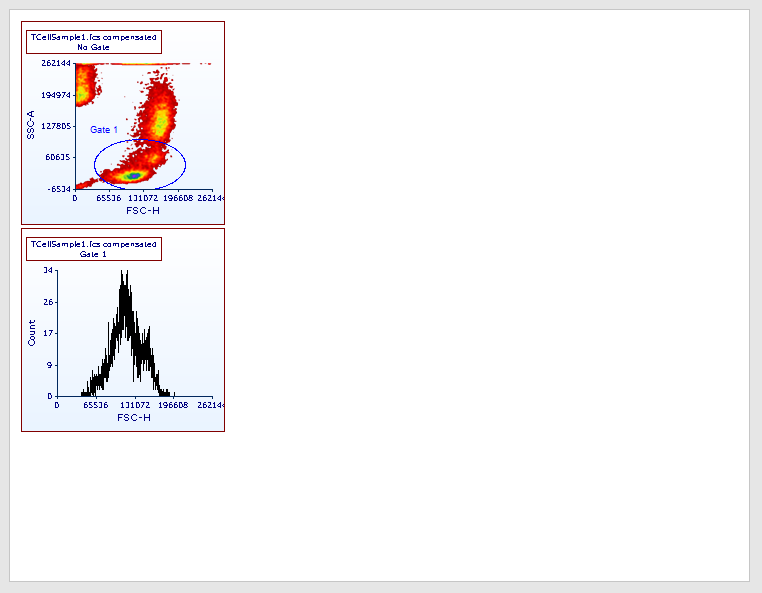
The layout should appear as shown in Figure T33.1.

Figure T33.1 - The Defining k-means.fey analysis layout.
The aim of this tutorial is to create k-means clustering on Gate 1, events are based on 3 out of the 6 fluorescence parameters (i.e. CD3, CD4 and CD8).
The following steps open the transformation window and create a new k-means transformation:
1.Open the Transformation window by selecting the Tools tab→Transformations →Transformations command  .
.
2. In the Transformation dialog, click on the drop-down arrow adjacent to the blue plus ![]() button and select Kmeans from the drop-down list (Figure T33.2).
button and select Kmeans from the drop-down list (Figure T33.2).

Figure T33.2. k-means transformations are created via the Transformation navigator.
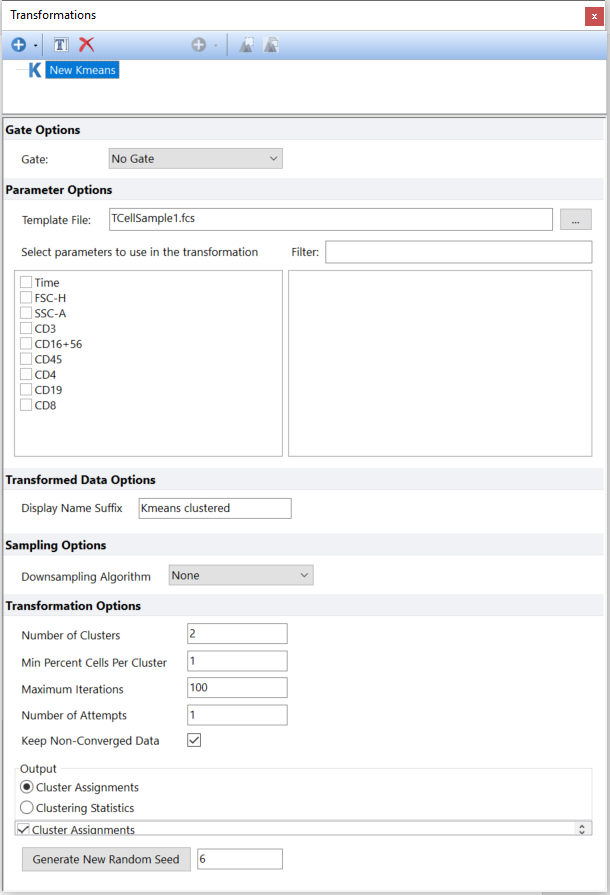
The Kmeans dialog will now appear in the Transformation window as seen in Figure T33.3.

Figure T33.3. The Trasnformation window as it appears after creating a new K-means transformation.
Note: the Template File field already contains the TCellSample1.fcs file, thus the file already loaded into the layout. When a transformation is created before any file is loaded into the layout, a template file will need to be selected by the user via the ellipsis button (![]() ) at the right of the Template File field.
) at the right of the Template File field.
We will now rename the new k-means transformation as My first k-means clustering:
4. Select the New Kmeans in the Transformation window.
5. Select the ![]() button from the Transformation window.
button from the Transformation window.
6.Type My first k-means clustering as the new name.
Please Note: other ways of renaming a k-means transformation are listed in the Defining a k-means cluster analysis topic of the manual.
We will now have to define the k-means clustering arguments. We will start by selecting the parameters the cluster will be based on, and the gate containing the events we want to cluster. Then we will specify additional required arguments such as the number of clusters, the maximum number of iterations, and the cluster minimum size. For a detailed description of each argument, please refer to the Defining a k-means cluster analysis topic of the manual.
7. Select Gate 1 from the gate drop down menu of the Transformation dialog.
8. Flag CD3, CD4 and CD8 parameters in the parameter list of the Transformation dialog.
Please note that a scale can be specified for each parameter via the Parameter Scaling Options section of the Transformation Dialog.
As for all Transformations in FCS Express, a Downsampling Algorithm can be selected. We will use all events in this tutorial (i.e. Downsampling Algorithm set to None).
9. Type 3 in the Number of Clusters field. This is the number of centroids and thus the number of clusters that will be created.
10. Type 100 in the Maximum Iterations field. This is the maximum number of iterations FCS Express will perform upon quitting the clustering algorithm.
11. Type 10 in the Min Percent Cells Per Cluster field. Iterations ending up with clusters containing less then 1% of events will be discharged and recalculated. This applies to all iterations except the last one.
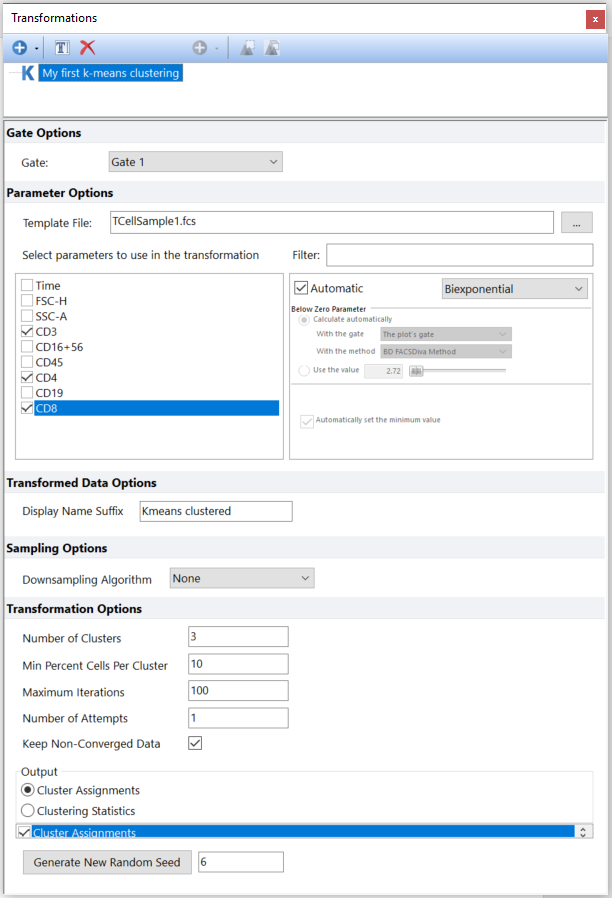
At this point, the Transformation dialogue should appear as in the following Figure T33.4:

Figure T33.4. The Transforamtion dialogue partially filled for a new k-means clustering transformation.
Now that the input parameters are selected we need to define the output style we want to use for the clustering result. FCS Express provides two output styles: Cluster Assignment and Clustering Statistics.
In this tutorial we will select the Cluster Assignment output style, which allows several graphical representations of the clustering results. For more details about the two different output styles, please refer to the Defining a k-means cluster analysis topic of the manual.
13. Select Cluster Assignment.
14. Flag Cluster Assignments, Gaussian CV SSE Scaled, Gaussian Y Data from the list located below the output styles. These will be the new clustering parameters that will be directly available in a 1D/2D plot and in Heat Maps.
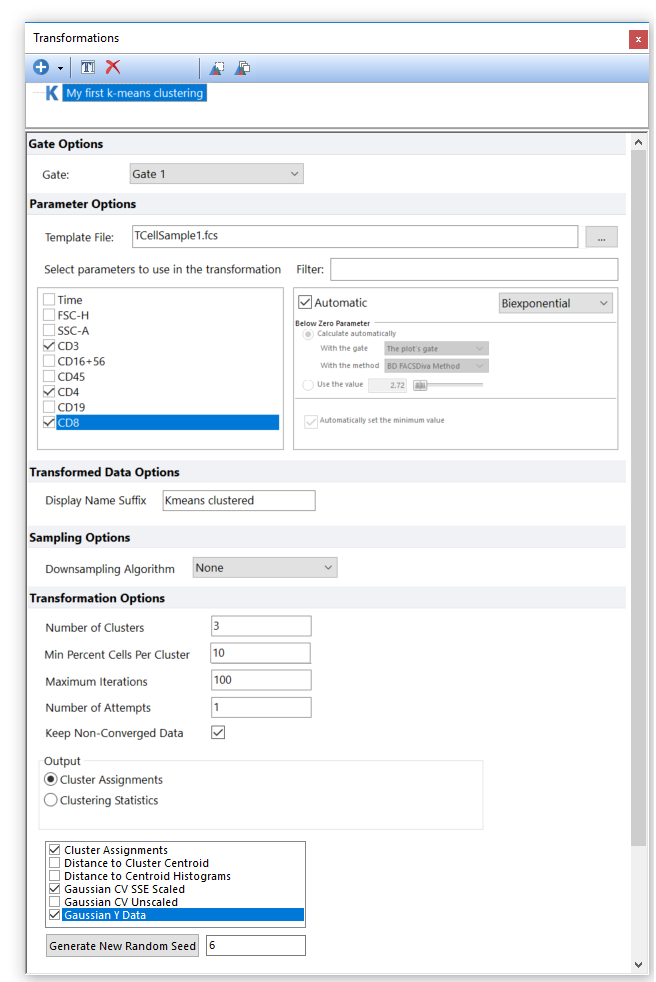
The Transformation dialogue should now appear as in the following Figure T33.5:

Figure T33.5. The Transformation dialogue filled for a new k-means trasnformation.
The k-means clustering has now been defined and automatically calculated. k-means clustering can now be applied to plots for display and analysis. Please proceed to the next part of this tutorial to see how to apply the k-means transformation to plots and plate heat maps.
