Applying a k-means clustering
Once k-means clustering has been performed, results can be accessed as 1D plots, 2D plots, Heat Maps and Data Grids depending on the selected output style (see the Defining a k-means cluster analysis topic of the manual for details). In the previous part of this tutorial, we selected Cluster Assignment as the output style that allowed us to create three clustering parameters; Cluster Assignments, Gaussian CV SSE Scaled, and Gaussian Y Data. These new parameters may be accessed on plots on which the transformation has been applied.
In this tutorial we will apply the k-means transformation to 1D plots, 2D plots and Plate Heat Maps.
Please Note: although different methods can be exploited in applying a transformation to plots, (please refer to the Applying a k-means Cluster Analysis topic of the manual for further info on this subject), in this tutorial, we will use the drag & drop method.
To open the layout required for this tutorial:
1.Select the File tab→Open.
2.Navigate to the Tutorial Sample Data folder and open the Applying k-means.fey layout stored in the k-means tutorial subfolder.
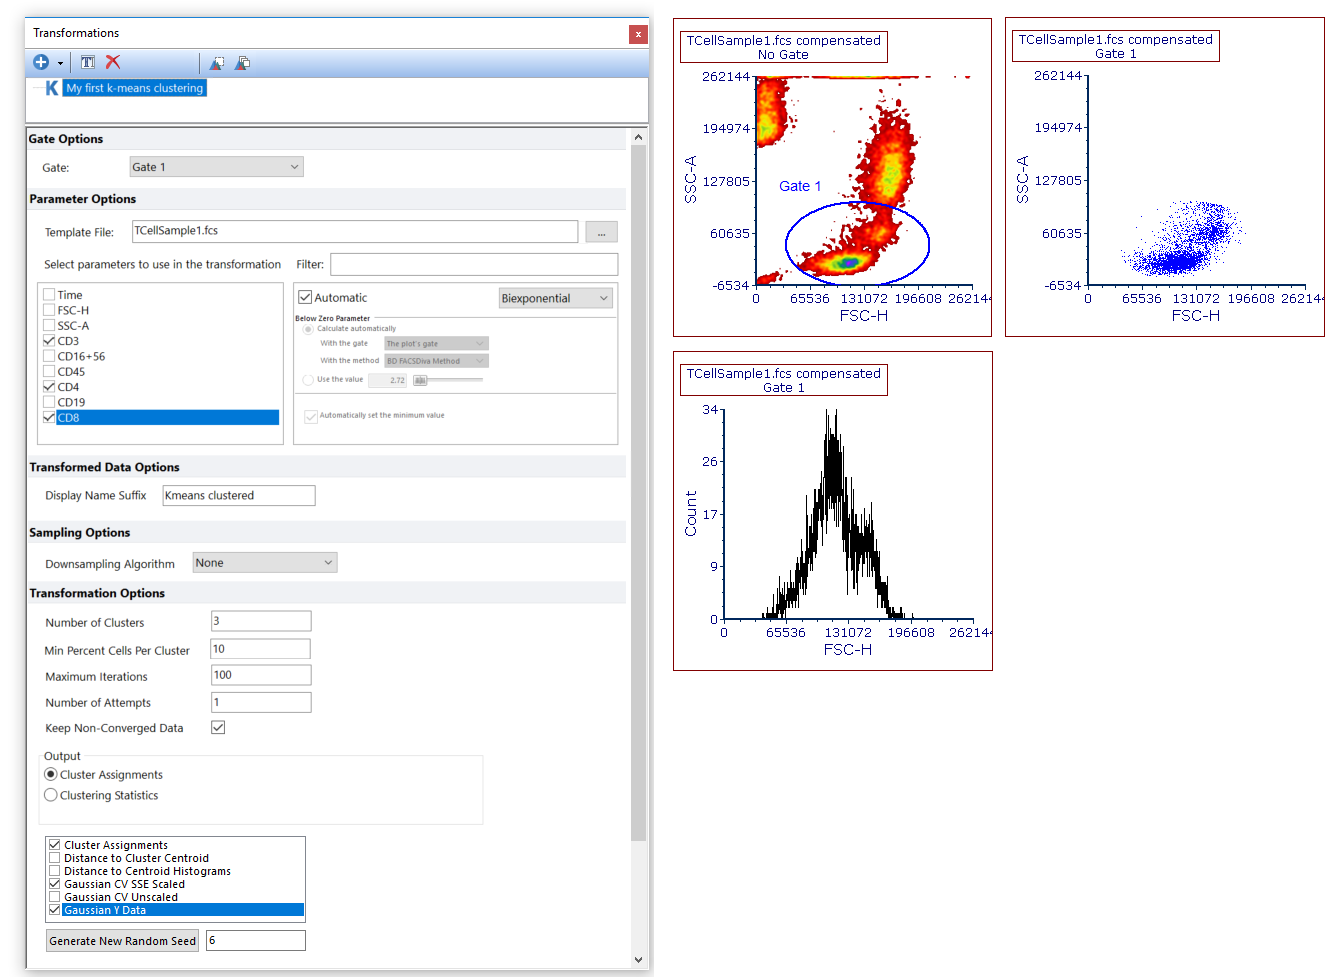
The layout should appear as shown in Figure T33.6. A Transformation window with the My first k-means clustering should also been opened.

Figure T33.6. The Applying k-means.fey layout as it appear after opening it.
Since we selected Cluster Assignments among the new clustering parameters, we will be able to display clusters using Plate Heat Maps. Thus, let's open a new plate heat map in the layout.
3.From the ribbon bar select Insert→Other Plots→Plate Heat Map.
4.Click in the place on the layout where you wish to insert the Plate Heat Map.
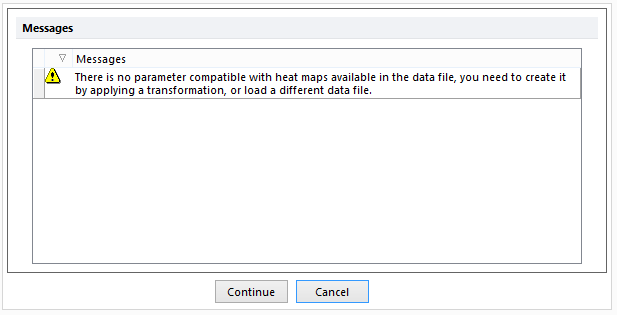
5.A message saying, there is no parameter compatible with Heat Maps available..., will open (Figure T33.7). Click Continue.

Figure T33.7. The message saying that no heat map compatible parameter is currently available.
6.Select the Plate Heat Map and then select Gate 1 from the Gating→Create Gates→Current Gate drop down menu. The Plate Heat Map where the cluster is displayed, will be gated on Gate 1, thus the same gate used for the k-Means clustering.
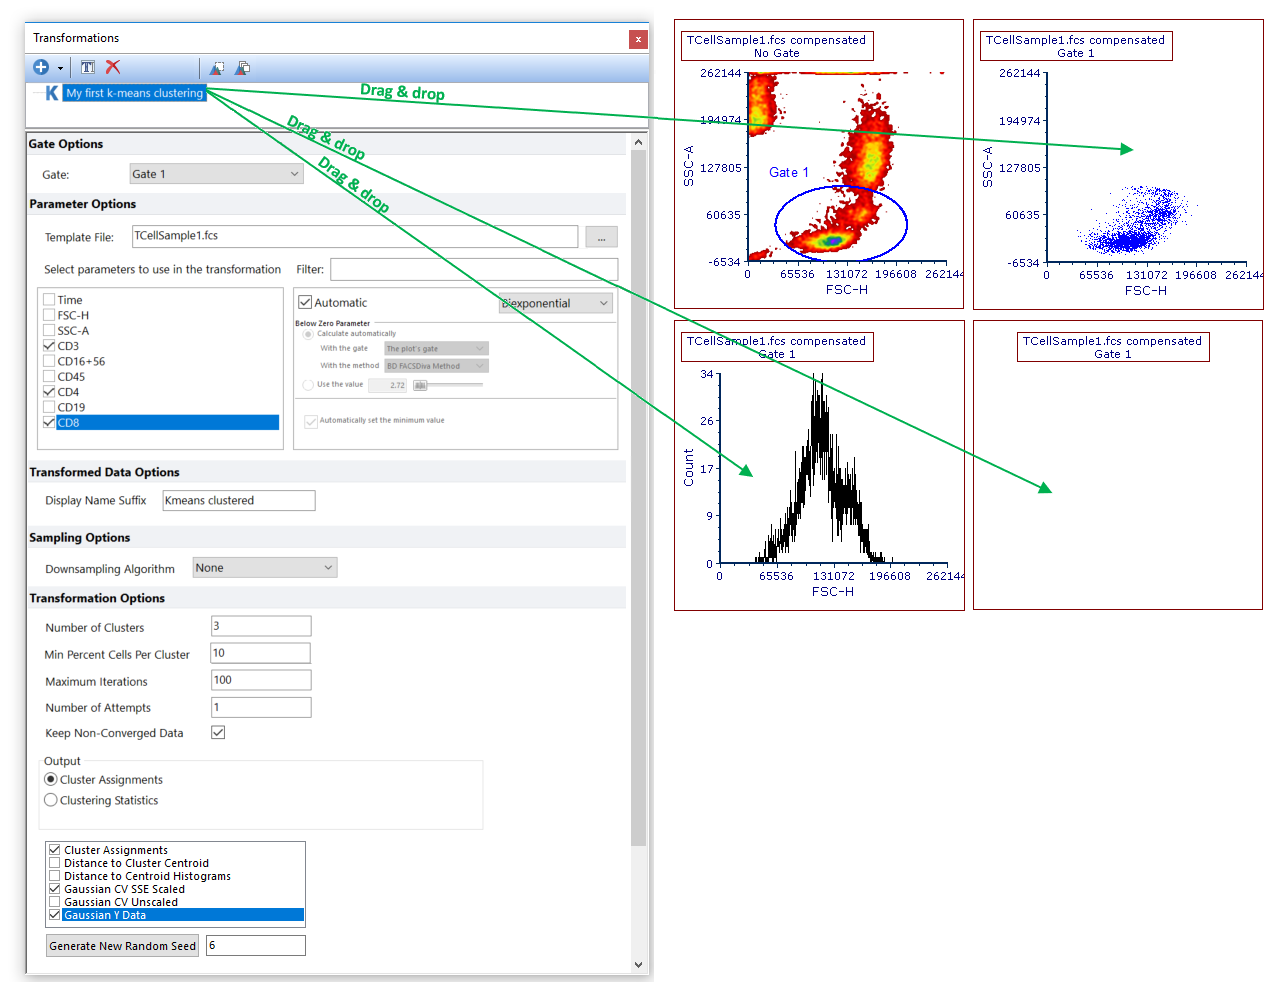
We will now apply the k-means transformation to all the plots present in the layout by drag & drop (Figure T33.8):
7.Left click and hold on k-means clustering from the Transformation window.
8.Drag the k-means transformation out of the Transformation window and release it on top of each of the 2D plot.
9.Repeat step 7 and release the transformation on top of the newly created Plate Heat Map.
10. Repeat step 7 and release the transformation on top of the histogram.

Figure T33.8. Use Drag & Drop to apply the k-means transformation to the objects of the layout.
The k-means is now applied to all the objects in the layout and the title of the plot will now include the text "Kmeans clustered" to indicate the transformation has been applied (Figure T33.9).

Figure T33.9. When a k-means transformation is applied to plots, the suffix "Kmeans clustered" is automatically added to the title.
Please Note: When a k-means transformation with Cluster Assignments parameter is applied to a Plate Heat Map, the latter automatically displays the Cluster Assignments parameter by plotting each cluster as a well. When a k-means transformation with parameters other than Cluster Assignments is applied to 1D or 2D plots, the clustering parameters can be accessed as standard flow cytometry parameters.
In the next section we will see how to work with clustering parameters.
