Working with k-means using Plate Heat Maps
When a k-means transformation with a Cluster Assignments parameter is applied to a Plate Heat Map, it automatically displays the Cluster Assignments parameter by plotting each cluster as a well. The k-means transformation available in this layout is defined by three clusters, thus 3 wells are displayed in the Plate Heat Map.
In this tutorial we will access the clustering parameter on the Plate Heat Map, and we will use the well gates to select clustered events. These well gates will then be available for downstream analysis.
For this tutorial we will use the k-means on heatmap.fey layout stored in the k-means tutorial subfolder of the Tutorial Sample Data folder.
To open the layout required for this tutorial:
1.Select the File tab→Open.
2.Navigate to the Tutorial Sample Data folder and open the k-means on heatmap.fey layout stored in the k-means tutorial subfolder.
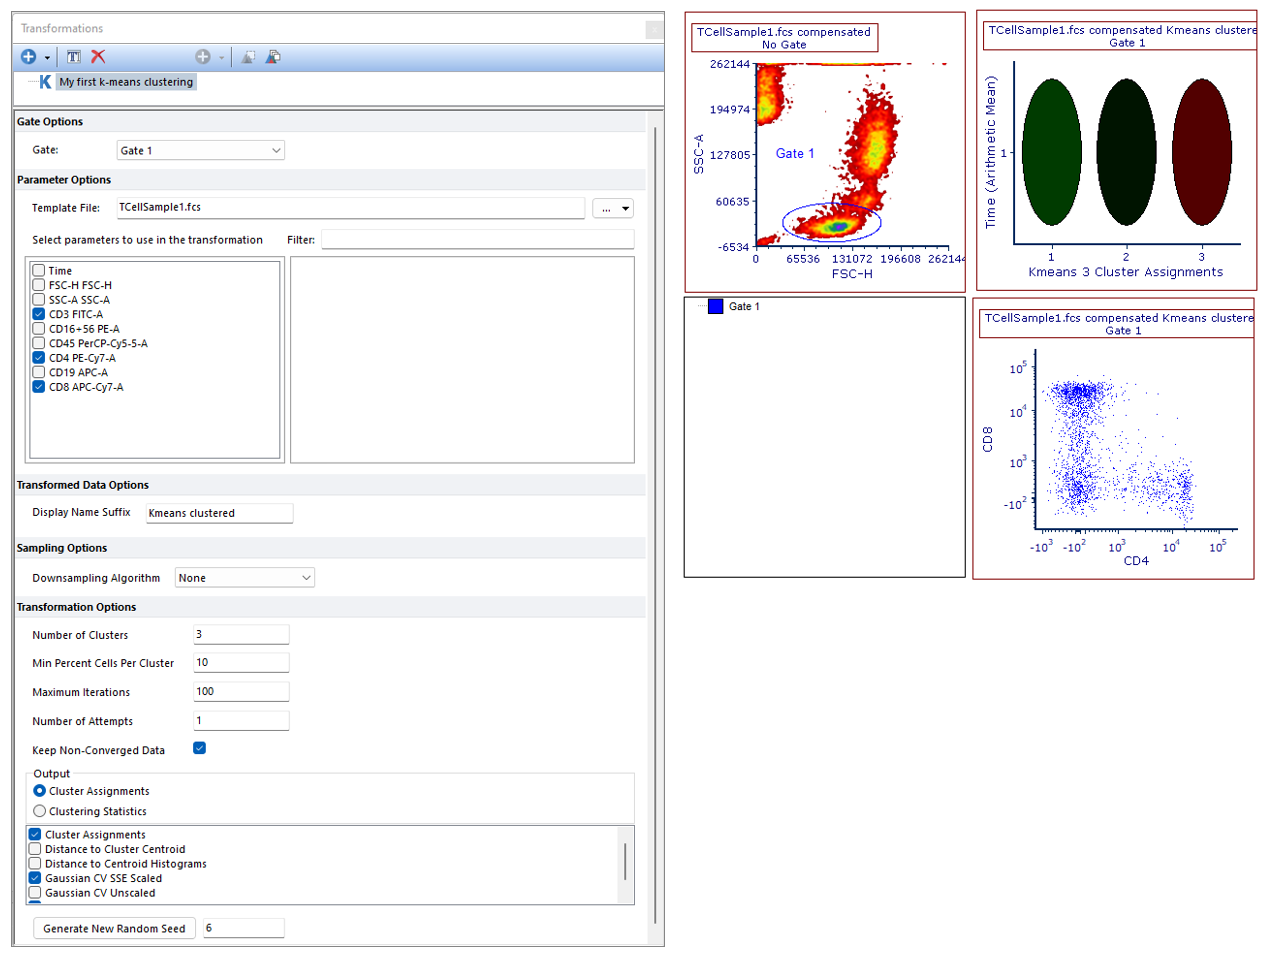
The layout should appear as shown in Figure T33.15:

Figure T33.15. The k-means on heatmap.fey layout as it appear after opening it.
In this layout a k-means transformation has been created and applied to a Plate Heat Map and to a color dot plot. In order to simplify the gate visualization, and to create a cluster gate with the correct hierarchy, Gate 1 (thus the gate on which the clustering has been performed) has already been applied to the color dot plot.
In this example, the following clustering parameters have been selected and thus automatically created as output results for the k-means clustering; Cluster Assignments (which is suitable for Plate Heat Maps), Gaussian CV SSE Scaled and Gaussian Y Data (which can be both accessed on 1D and 2D plots, see the previous section of this tutorial). To read more about the clustering parameters, please refer to the Defining a k-means cluster analysis topic of the manual.
We will now select clustered events using well gates on Plate Heat Map.
3. Right click on the Plate Heat Map and select Create gate→Well from the right click menu.
4. Select cluster 1 by left clicking on it. A Create New Gate dialog opens.
5. Create Gate 2 and name it as Cluster 1 on Heat Map as gate name, and have Gate 1 as the Parent Gate and click OK.
6. Click Close in the Edit new gate dialogue. The new gate named Cluster 1 on Heat Map is now listed in the gate view.
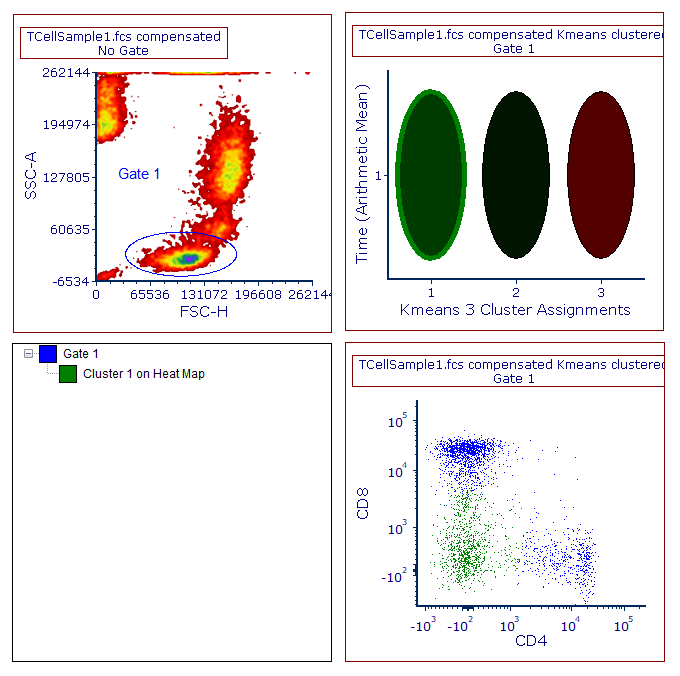
7. Right click on the Heat Map and select Show Gates→Cluster 1 on Heat Map from the right click menu. The gate is now visible on the Plate Heat Map as a border around cluster 1.
The content of the layout should now be similar to the one displayed in Figure T33.16. Please note that the new gate is now listed in the gate view, and that the events belonging to cluster 1 are now green in the color dot plot.

Figure T33.16. A well gate has been created to select cluster 1. The gate view and the color dot plot reflect this change.
Note: The Cluster 1 on Heat Map gate can also be applied to a plot, and to other objects in the layout just as any other gate.
