Specific Options

Contents
The Specific Options category contains a variety of properties that control how data on the histogram is displayed.
Note: Please see the Spectrum Plots chapter for unique Specific Options associated with Spectrum plots.
You can edit histogram specific options in one of two ways:
•Select the histogram(s) and use the Format→Plot Options→Specific Options command.
•Right-click on the histogram, select Format from the pop-up menu, and choose the Histogram→Histogram Specific Options category (Figure 5.27).

Figure 5.27 Formatting Histogram Specific Options
The options are described in the table below. See Resolution Overview for a further description of resolution options.
Option |
Explanation |
|---|---|
If different overlays contain different numbers of events in a channel, they may not look alike even if the data comes from an identical population. Overlays can be normalized based on the number of events or based on the peak value. The reference, for both the number of events or the peak value, can be an overlay (select the Based on Overlay radio button and select an overlay from the drop-down list. The number of events in other overlays will be normalized to appear to have the same number of events as the selected overlay.) or a custom value (select the Based on Value radio button and type the custom value in the corresponding field). |
|
Cells to Plot Options (only available for Kinetics plots) |
Control how many cells are plotted/visualized. With the radio buttons, choose the cell number range or number of cells plotted option. Then, select a value from the drop-down list or enter in freetext into the from and to boxes, as appropriate. Note that statistics for Kinetics fitting are calculated based on the plotted cells only. |
Plot resolution |
In the first drop-down menu, choose whether to use the resolution specified in the data (Derive from data file) or select your own resolution from the second drop-down menu. Choosing a resolution lower than the true resolution of the plot is an effective way of smoothing your data. When the Derive from data file option is selected, FCS Express chooses the highest resolution possible depending on the data with a max of 1024. |
Use channel calibration on axis |
FCS Express can establish calibrated values for the axes. If channel calibrations are defined, toggling this checkbox will determine whether or not to use the calibrated values in place of the generic channel numbers. Note that this option does not apply to Spectrum Plots. |
FCS Express can automatically perform histogram subtraction to calculate the number of positive cells. Select which overlay is the control. |
|
Display multiple overlay data |
Display overlay data in a single histogram (Overlaid) or use a split view (Stacked). See Figure 5.28.  Figure 5.28 A Histogram with Two Overlays in Stacked View |
If multiple overlay data is displayed Stacked, choose the Y Axis Title to use. |
|
Stacking Position |
For stacked histograms only.
•Automatic option will result in overlays of equal height spaced equally apart from one another. •Overlay Scaling Factor can be set between "0" (which will result with a 1D overlay rather than Stacked appearance) and "3" (which will maximize the vertical space between stacked histogram overlays). The default is "1", which minimizes space between stacked overlays while avoiding overlap. See examples below.
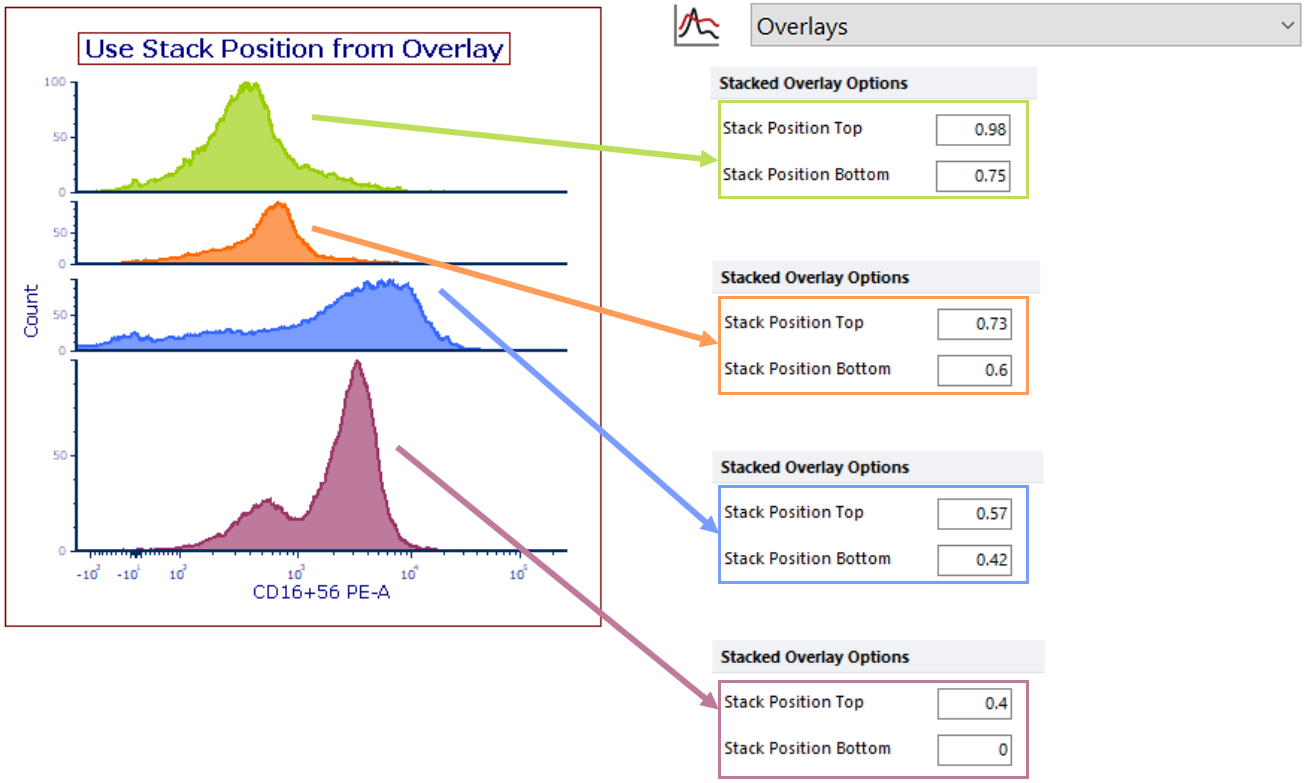
•Use Stack Position from Overlay allows for overlays with unequal height and spacing. Stack Position Top and Bottom values define the higher and lower bounds of each overlay within the entire graph's Y-dimensional plotting space and must be entered as values between "0" and "1" for each overlay in Overlays→Stacked Overlay Options. See example below.
|