Subtraction Plots
Histogram subtraction allows for the determination of the percent positive on a histogram by subtracting a negative control histogram from a sample histogram. In FCS Express, this subtraction can be performed by using a Subtraction Plot.
To insert a Subtraction Plot, select the Insert tab→ 1D Plots→ Subtraction command, and click once on the layout where you want the plot to be inserted. The Subtraction plot will default to showing the current data file in the first overlay, and no data file in the second overlay. The first overlay will by definition serve as control. The order of the overlays can be changed via the up and down arrows in the Overlays category of the Formatting dialog (Figure 5.22).

Figure 5.22 . Upper pane of the Subtraction Plot Overlays dialog.
The data files can be changed by either of the following methods:
•dragging and dropping two data files from the Data List onto the Subtraction plot, which will replace both overlays, or
•changing each overlay to another data file by the usual methods.
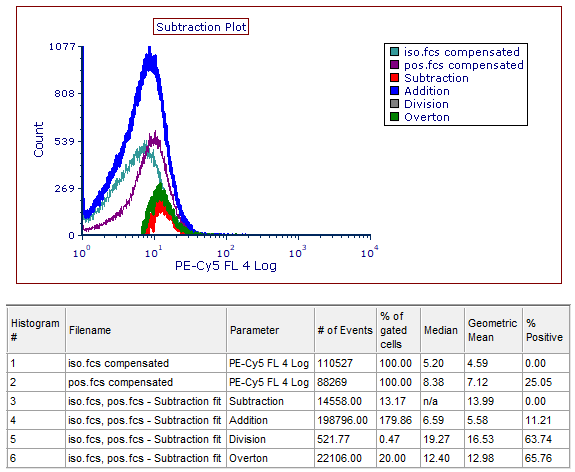
An example of a completed Subtraction Plot and its associated Histogram Statistics window, for which there will be a row of statistics for each overlay that is checked as "visible", is shown below in Figure 5.23. In addition to the two source overlays defined by the user (i.e., the "iso.fcs" and "pos.fcs" overlays), there are four additional overlays, defined in the Table below:

Figure 5.23 . A Subtraction Plot and its associated Histogram Statistics window.
Overlay |
Description |
|---|---|
Subtraction |
The control histogram is subtracted from the sample histogram on a channel by channel basis. |
Addition |
The control histogram is added to the sample histogram on a channel by channel basis. |
Division |
The sample histogram is divided by the control histogram on a channel by channel basis. |
Overton |
This technique is similar to the channel by channel subtraction method, in which the control histogram is subtracted from the sample histogram on a channel by channel basis, except that negative differences (where the number of cells in control channel N is greater than the number of cells in sample channel N) are added to the positive differences in lower channels. After all channels have been analyzed, residual negative results are set to zero, and the sum of the positive results is divided by the total number of cells to yield a percent positive. |
The percent positive on a histogram can also be set up to be automatically calculated and appear in the "% Positive" column of the Histogram Statistics window, as shown in the figure above. In this case, the Overton Subtraction method is used. To have the histogram subtraction automatically performed and displayed in a histogram statistics window:
•Make sure the percent positive column is visible for the statistics window.
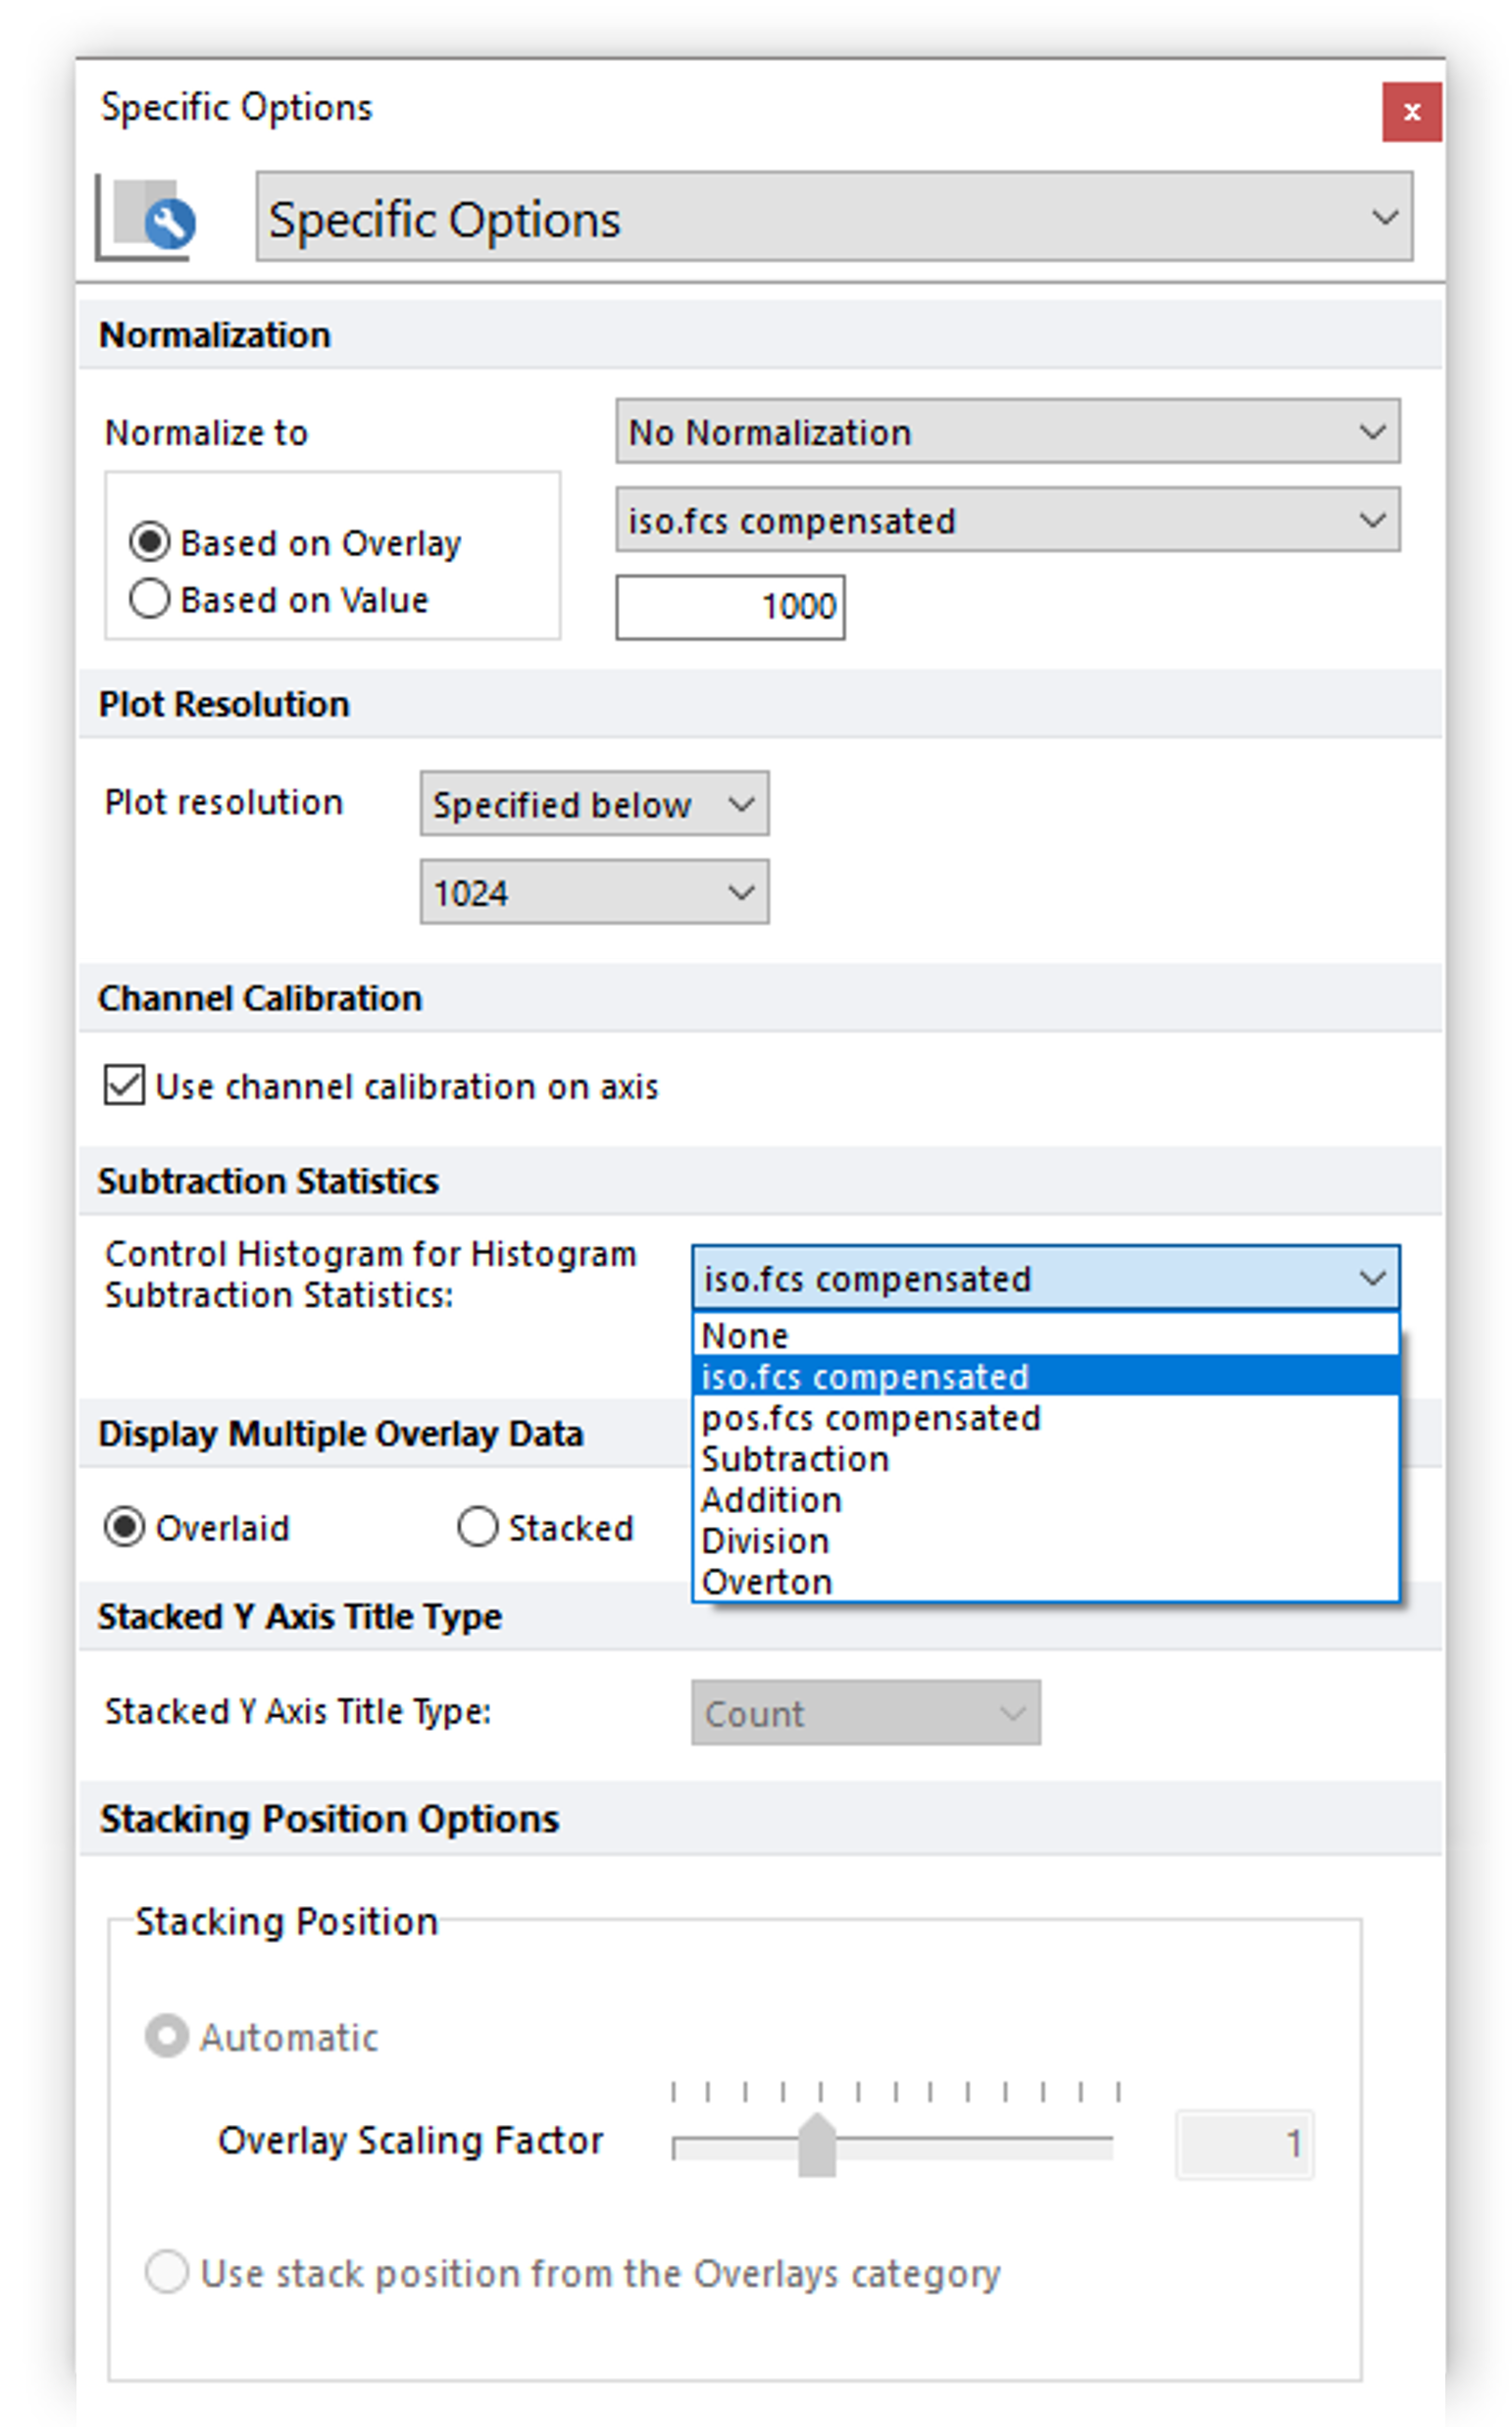
•Use the Format tab→Plot Options→Specific Options command (or right-click on the histogram, choose Format from the pop-up menu, and select the Specific Options category from the drop down menu). Set the Control Histogram for Histogram Subtraction Statistics field to the appropriate negative control, which should be the first overlay (Figure 5.24 ). Statistics histogram subtraction always uses the Overton Subtraction method, described in the table above.

Figure 5.24 . Setting the Control Histogram in the Formatting Specific Options Dialog
