Marker to Gate Linking
In the course of this example, we will:
•Link a marker to a gate.
•Move a marker with a linked gate and watch the gate automatically adjust.
A marker can also be created directly on a 2D plot by selecting the Gating→Create Gates→Create Marker command. For more information on creating a 1D gate on a 2D plot, please refer to the appropriate section in the tutorial on Using Gates.
1.Select File tab→Open.
2.Open the layout Marker2RegionLink.fey found in the Tutorial Sample Data archive.
This layout contains one 2D plot and two histograms of the file GFPsample.002 (Figure T7.4). The upper left plot is of FSC vs SSC with a gate on Whole Cells. The upper histogram is of FL1 gated on Whole Cells with a marker M1. The lower histogram is also a histogram of FL1 but without a marker.
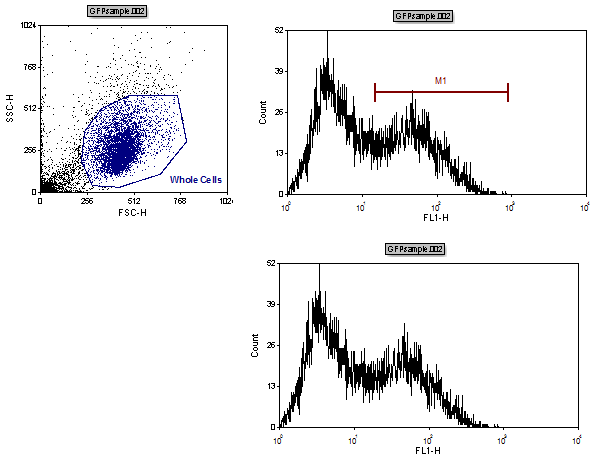
Figure T7.4 Marker2RegionLink.fey Layout
3.Right-click the upper right histogram of FL1 with the M1 marker.
This will bring up the associated pop up menu.
4.Select Convert Marker to Gate→Marker #1 (M1) from the pop up menu (Figure T7.5, blue highlighted text).

Figure T7.5 Converting the Marker M1 to a Gate
A Create New Gate dialog will appear as shown in Figure T4.7. Here, we will name the new gate that is linked to the marker.
5.Enter "GFP+" in the Create a new gate named field.
6.Choose Green for Gate Color.
7.Click OK (Figure T4.7).
8.Click inside the histogram of FL1 on the lower right without the marker. The border will appear green (Figure T7.9).
9.In the Gating tab, select GFP+ from the Current Gate drop-down list (Figure T7.6, red arrow). Note - Additional icons from the Gating tab ribbon have been removed to create this image.
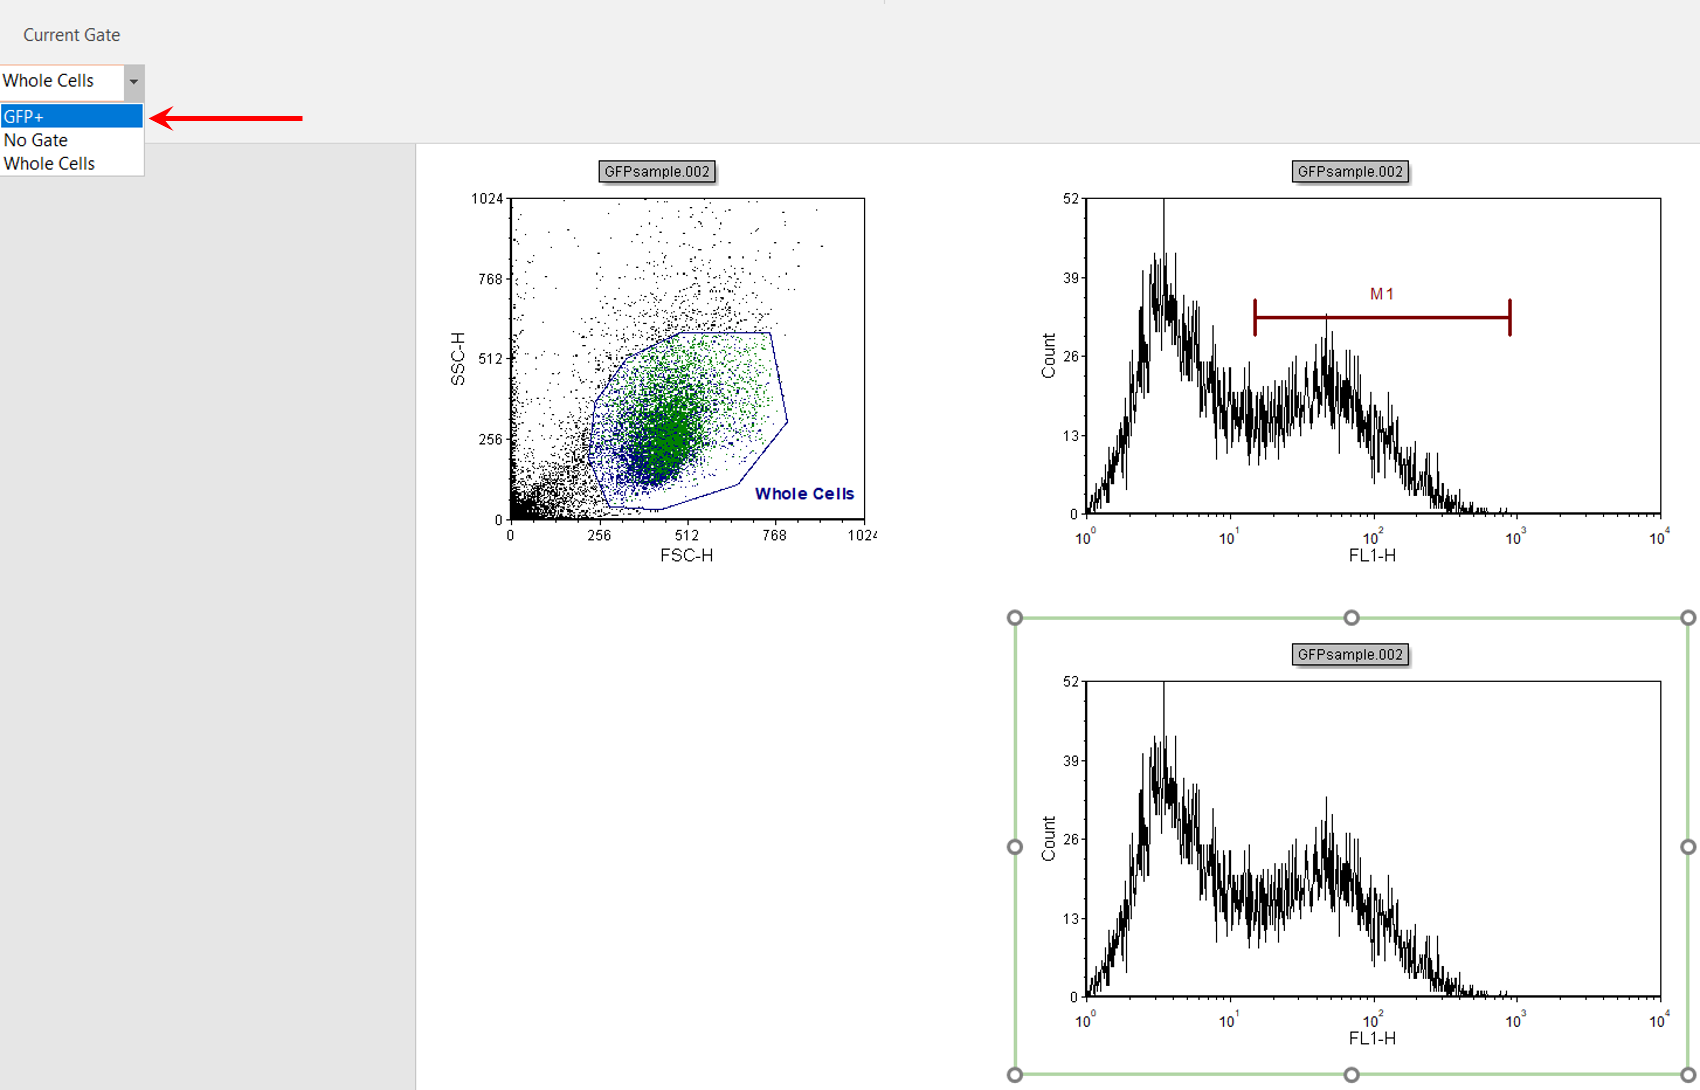
Figure T7.6 Applying the GFP+ Gate to the Lower Right Histogram
The histogram on the lower right will now appear with only the events within the marker M1 (Figure T7.7).
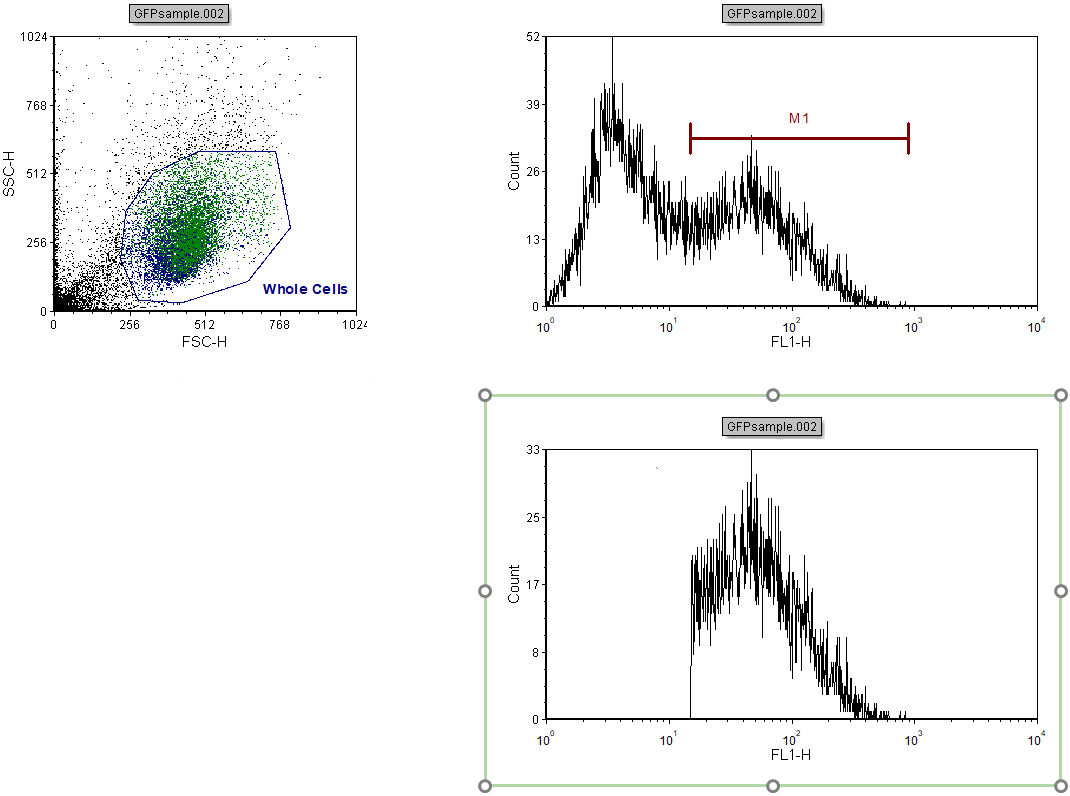
Figure T7.7 Lower Right Histogram Gated on GFP+
Because the marker M1 is linked to the GFP+ gate, changing the marker position also updates the gate.
10. Click inside the histogram of FL1 with the marker M1, located in the upper right of the layout. The border will appear green.
11. Click the left mouse button anywhere on the marker M1 to select it. The marker will have vertices (left/lower bound, central vertex, and right/upper bound) when it has been selected for editing (Figure T7.8).
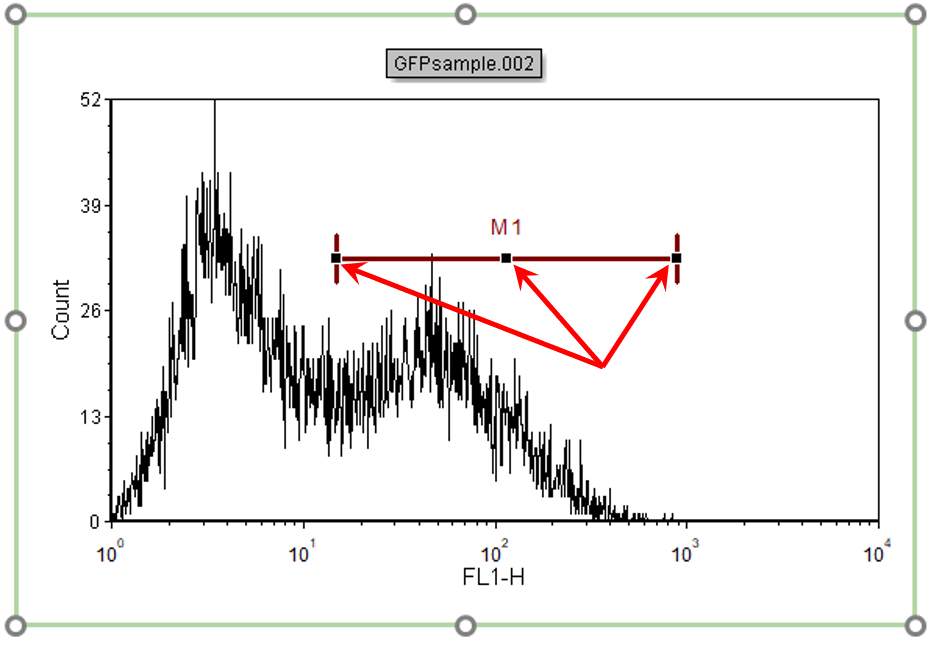
Figure T7.8 Active Marker M1 with Vertices Indicated by Arrows
12. Move the mouse over the central resizing rectangle. You will know you are in the correct place because the cursor will change to a four-headed arrow.
We now will move the entire marker M1 to a new location on the histogram. Alternatively, we could resize the marker by selecting and moving one or both of the lower and upper bounds of the marker.
13. Click and hold down the left mouse button on central vertex.
14. While holding down the mouse button (Figure T7.9).
Arrows pointing down will appear indicating the location of the ends of the marker on the x-axis. On top of the marker will be the channel numbers indicating the end boundaries of the marker (Figure T7.9).
15. Release the mouse button when the marker is in the desired position (Figure T7.9).
16.
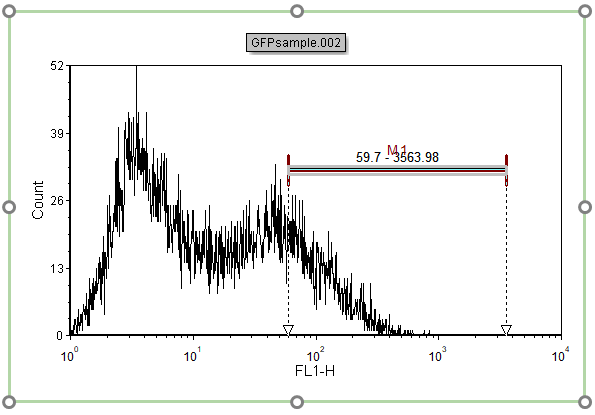
Figure T7.9 Moving Marker M1
The histogram of FL1 located on the lower right will update to reflect the changes made to the marker M1 (Figure T7.10).
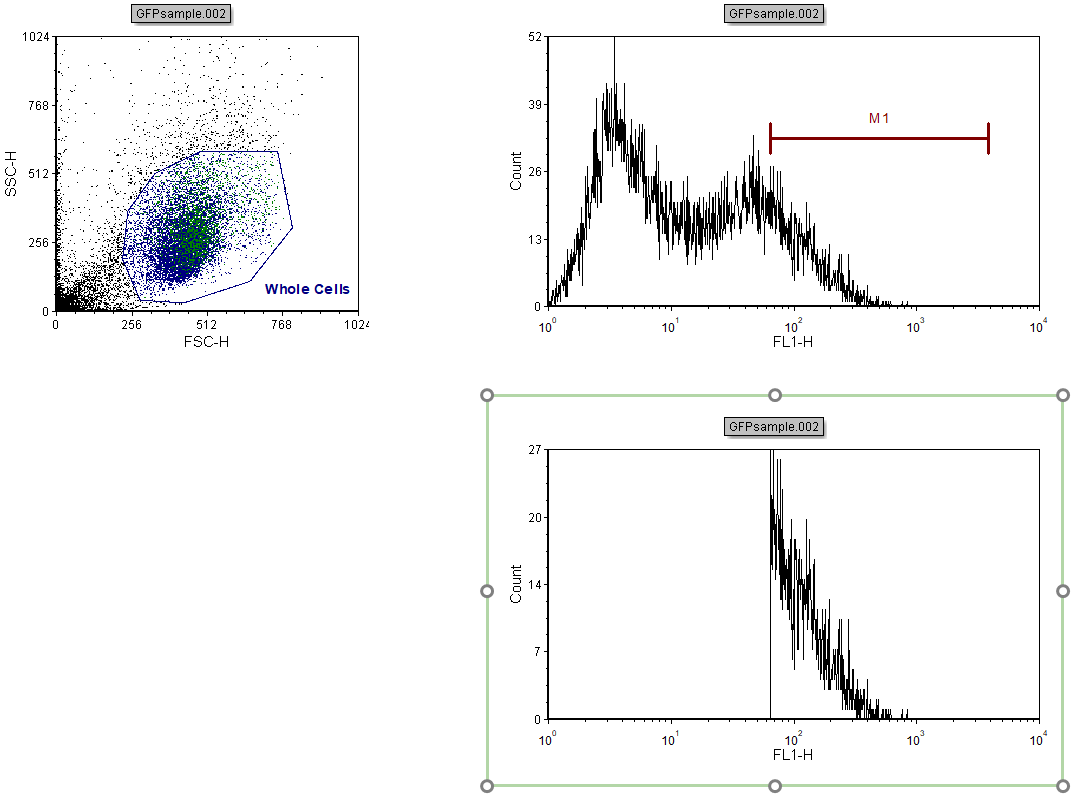
Figure T7.10 Histogram Gated on GFP+ Updated to Reflect Changes made to Marker M1 Position
