自动补偿
从单染对照中创建一个自动补偿定义,步骤如下:
| 1. | 请选择File(文件)标签→Open(打开)(图T3.1)。 |
| 2. | 请打开教程样本数据库中AutoComp.fey版面。 |
这一版面就是我们将要用来演示如何设置自动补偿的版面(图T8.6)。此时,您将是以一个空白版面开始,但为了让您更简单的看到您的数据,我们已经在该版面插入几个绘图。左上角的绘图是根据一个磁珠群体画的FSC vs. SSC 数据。要使用自动补偿,用户需要为每一个要补偿的参数准备一个单染色的对照样本和一个未染色的样本。
(注:未染色对照作可为常用的阴性对照、通过圈门定义的阴性群体或者带有阳性对照管的阴性群体。在这一例中,我们将使用一个未染色样本)
后面的数据设置包括涉及以下参数( FITC、PE、PC5 (PE Cy5)、PC7 (PE Cy7)和APC)的一个未染色对照、所以颜色对照和5个单染对照。所有的直方图均来自Beads gate及每个对照显示的数据文件和参数。例如,右上方的直方图来自Compensation Controls_FITC Stained Control.fcs文件,FITC-A参数也被展示在X轴上。
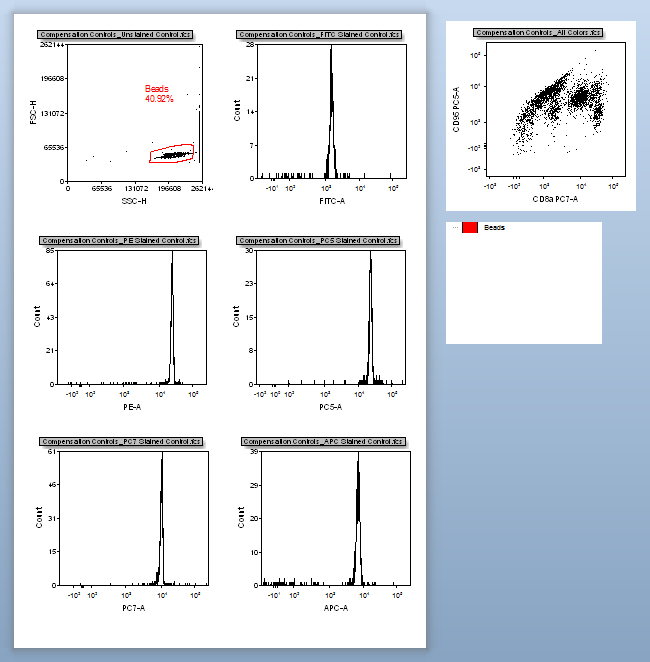
Figure T8.6 Autocomp.fey Layout
在本例中,我们将为上述5个单染对照设置补偿。但实际应用中,用户可进行任意数目参数补偿的设置,只要用户为每个要补偿的染色通道准备一个单染色的阴性对照。
| 3. | 点击Data(数据)标签→Data Info(数据信息)→Compensations(补偿)命令,用以打开Compensations(补偿)导航器(图T8.7)。 |
此Compensations(补偿)导航器可移动到屏幕的任意位置,它是可停靠的和固定住的。在进行该教程时,用户可根据需要任意在版面中将其移动。
| 4. | 点击绿色加号按钮, |
一个带有New Compensation(新的补偿)文本的文本框将出现,并突出显示为蓝色(图T8.7)。
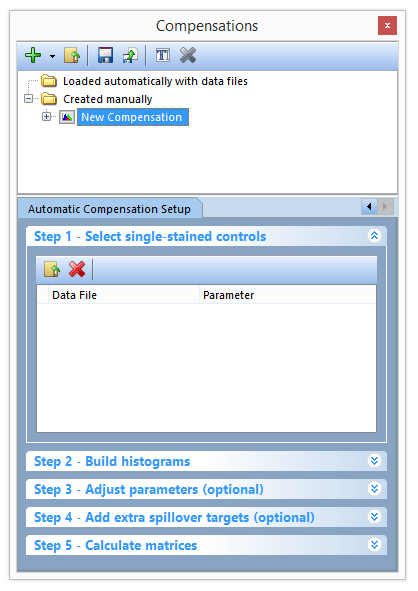
Figure T8.7 - The Compensations navigator. Use the navigator to add new compensations, edit definitions, and to create new Automatic Compensation Setups.
| 5. | 在Automatic Compensation Setup(自动补偿设置) |
| 6. | 点击Data List(数据列表)标签(图T8.8)。 |
| 7. | 在数据列表中选择所有的文件(图T8.8)。 |
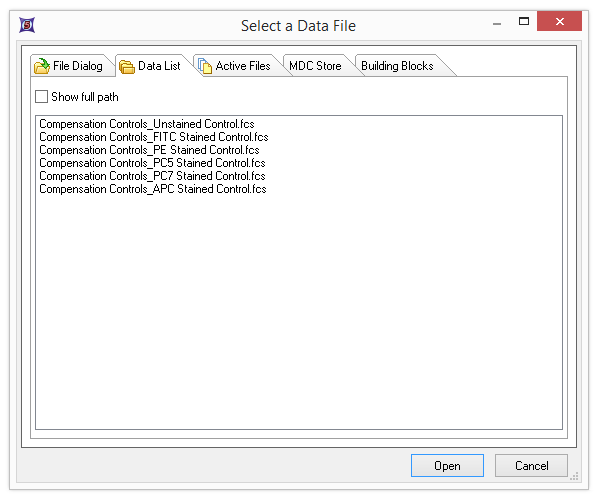
Figure T8.8 - Use the Select a Data File window and Data List tab to select all of the files for use in the Automatic Compensation Setup.
| 8. | 点击Open(打开)。 |
注意:所有的单染对照文件和未染色对照文件已经被带到Select single-stain control(选择单染作为对照)窗口(图T8.9)。我们现在将要为每个文件分配正确的参数,通过将文件名中的单染对照名称与-select parameter(选择参数)-下拉列表中的参数相匹配。
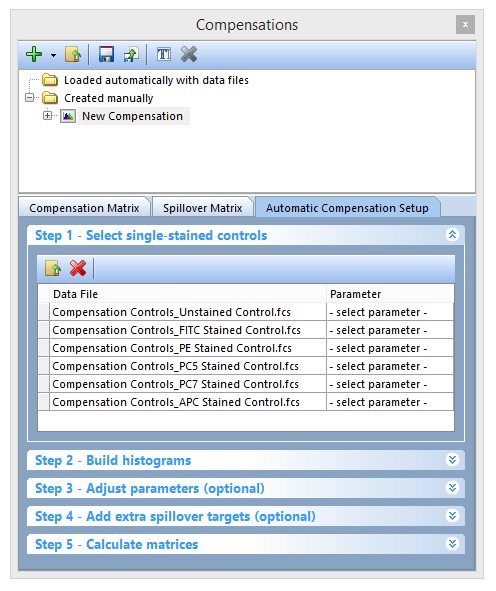
Figure T8.9 - Files have been added to Step 1 in the Automatic Compensation Setup. The Parameter column drop downs will be used to match the single stained sample data control files to the respective parameter for compensation.
| 9. | 为第二个文件点击-select parameter(选择参数)-(Compensation Controls_Unstained Control.fcs)(图T8.10)。 |
| 10. | 在-select parameter-(选择参数)下拉列表中,选择底部的Universal Negative(常规阴性)(图T8.10)。 |
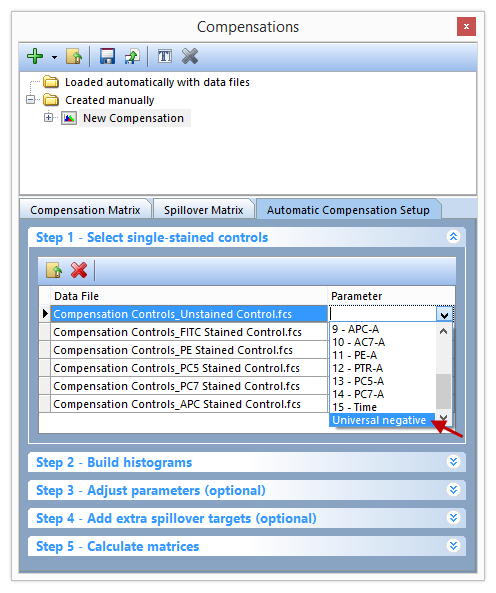
Figure T8.10 - Selecting the Universal negative parameter to match the Unstained Control.fcs file.
这将使得Compensation Controls_Unstained Control.fcs文件与Universal Negative(常用阴性对照) 相匹配。
| 11. | 为第二个文件点击-select parameter-(选择参数)(Compensation Controls_FITC Stained Control.fcs)(图T8.11)。 |
| 12. | 从-select parameter-(选择参数)下拉列表中选择7- FITC-A(图T8.11)。 |
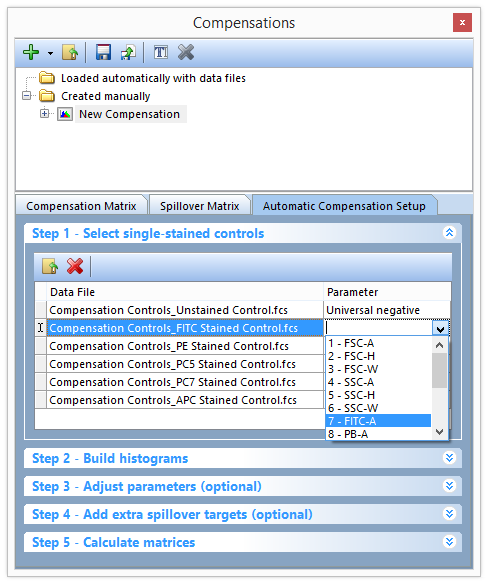
Figure T8.11 - Selecting the FITC-A parameter to match the FITC Stained Control.fcs file.
| 13. | 重复第11步和第12步来为每个单染对照和参数相匹配。例如,PE Stained Control.fcs必须与11 -PE-A相匹配。此时,Step 1 - Select single-stained controls(第一步-选择单染作为对照)窗口将如图图T8.12所示。 |
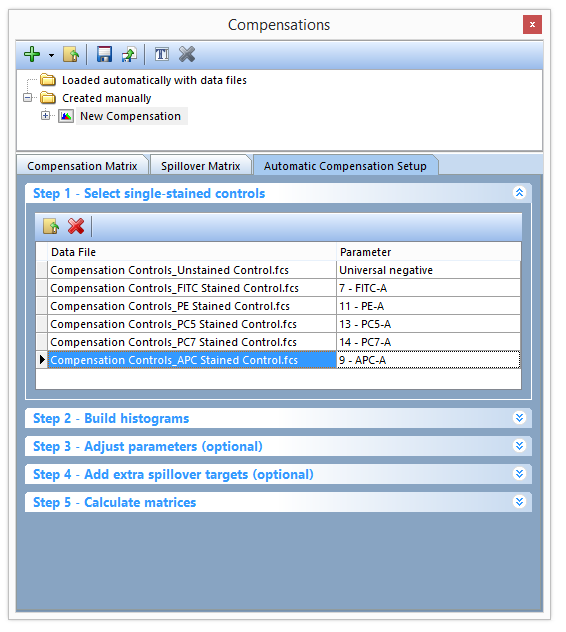
Figure T8.12 - All Parameters have been matched to their respective single stain control.fcs file.
| 14. | 点击Step 2 - Build histograms(第2步-构建柱状图)来使构建直方图窗口展开(图T8.13)。 |
| 15. | 点击Build Histograms(构建柱状图)按钮(图T8.13)。 |
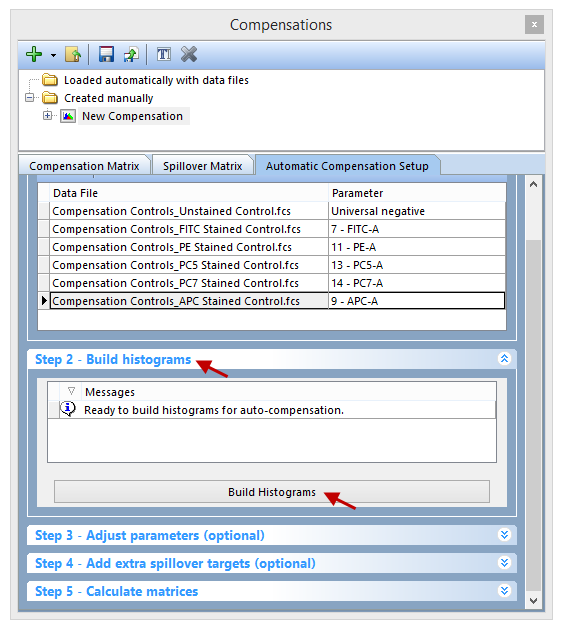
Figure T8.13 - The Build Histograms button will create a new page for scatter parameters and a new page containing a postive control and negative control histogram for each individual stain.
6个新的页面将被创建(图T8.14):
| • | Scatter Plot(散点图) |
| • | FITC-A control |
| • | PE-A control, PC5-A control |
| • | PC7-A control |
| • | APC-A control |
此Scatter Gate(散点图门)页面包括根据前两个参数数据的绘图,其他的页面(单染对照页面)包括针对每个参数补偿的2个柱状图。上面的柱状图显示的是该参数单染对照的阳性群体,下面的柱状图显示的是常用阴性对照的阴性群体。每个阳性和阴性群体的柱状图标记都是被自动创建的,且每个柱状图标记都被自动转换及与一个门关联。所以的柱状图标记/门都是Scatter Gate(散点图门)的子门,这就意味着调整Scatter Gate(散点图门),柱状图标记/门也将随之更新。
我们现在将对Scatter Gate(散点图门)进行一些调整,用以对自动生成的、针对单染和阴性群体的标记/圈门进行改善。
更好的对Multiple Page(多个页面)上提到的绘图进行鉴别,步骤如下:
| 16. | 点击View(视图)标签→Multiple Pages(多重页面)→Two Pages (Vertical)(纵向双页)命令。 |
| 17. | 请选择Scatter Plot(散点图)页。 |
| 18. | 选择FITC-A control页。 |
您的屏幕现在看起来如图T18.14所示。
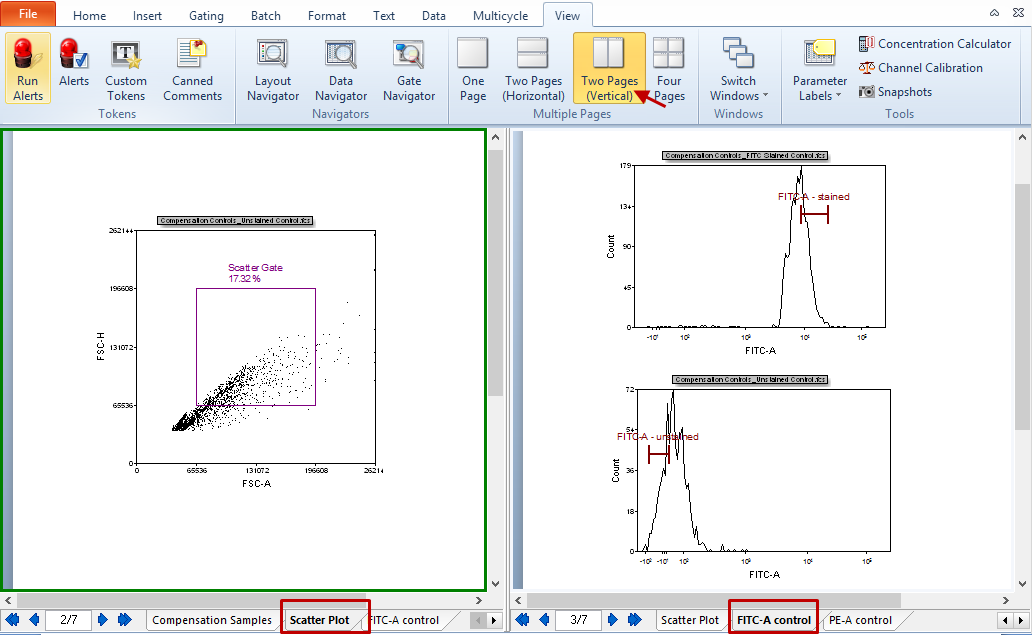
Figure T8.14 - Clicking on the build histograms button results in a Scatter Plot page and a new page with every single stained control.
在这一实例中,对于定义的散点图,FSC-H vs FSC-A并不是正确的参数,所以我们将用一个更合适的来替代Scatter Gate(散点图门)。
| 19. | 将未染色对照点状图(左页面)的X轴参数变为SSC-H(图T8.15)。 |
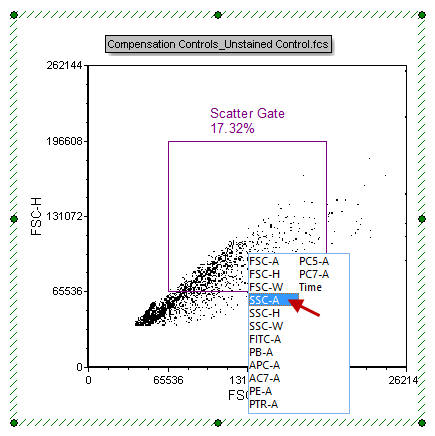
Figure T8.15 - Changing the X-Axsi parameter to SSC-H.
| 20. | 选择Gating(门操作)标签→Create Gates(创建门)→Rectangle(矩形门)。 |
| 21. | 如图T8.16(左面板)所示,在磁珠群体周围画一个门。 |
| 22. | 此时,Create New Gate(创建新门)对话框会出现。 |
| 23. | 选择Replace an existing gate(替代一已有的门)单选按钮(图T8.16)。 |
| 24. | 从下拉列表的底部选择Scatter Gate(散点图门)(图T8.16)。 |
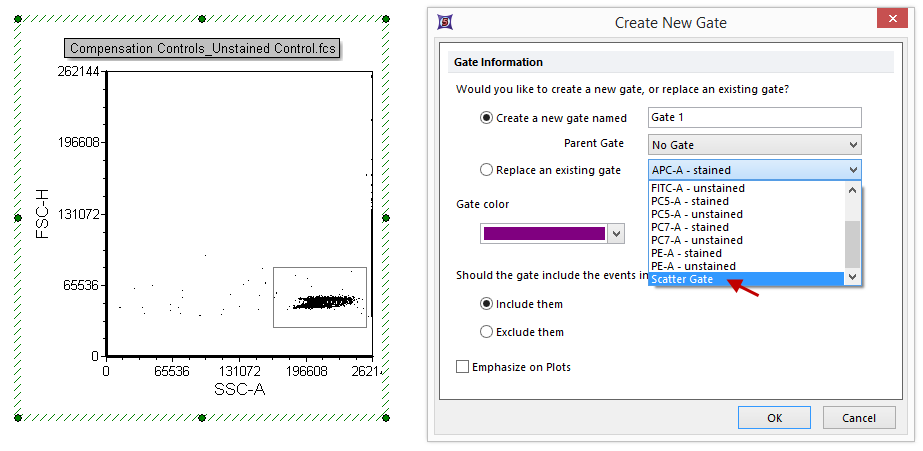
Figure T8.16 - Creating a gate around the bead population on the plot and choosing to replace the Scatter Gate with the newly created gate.
| 25. | 点击OK。 |
注意:原始的散点图门已被用户定义的新门取代。对于取代原始的散点图门,这一操作很方便,因为版面中所有的单染对照柱状图都已经使用该门。如果我们已经创建了一个新门,那我们就必须将该门应用到单染对照柱状图。注意:之后的单染对照柱状图页面也将随着新门更新。
在该版面(包括单染对照柱状图的版面)后面的页面中,用户可决定标识的位置。
我们将在第五步完成Automatic Compensation Setup(自动补偿设置)。自动补偿设置中的第3步和第4步是可选步骤,在本教程的最后我们将进行介绍。
| 26. | 点击Compensations(补偿)导航器中的Step 5- Calculate matrices(第五步-计算矩阵)。 |
| 27. | 点击Calculate matrices (矩阵计算)按钮(图T8.17)。 |
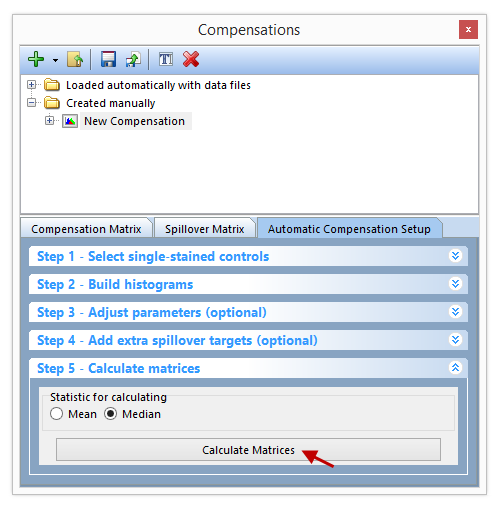
Figure T8.17 - Click the Calculate Matrices button to complete your automatic compensation setup.
矩阵的所有补偿和溢出都将被自动计算,然后显示于Compensation Matrix(补偿矩阵)和Spillover Matrix(溢出矩阵)标签中。此Editor(编辑器)可从Matrix Editor(矩阵编辑器)中的List Editor(列表编辑器)来进行更改,用以查看矩阵或者列表表格中的补偿定义(也可在Spillover Matrix(溢出矩阵)标签中进行)。(图T8.18 所示)
注意:您获得的值和图T8.18可能略有不同,因为在第20-25步骤中绘制的散点图可能有所不同。
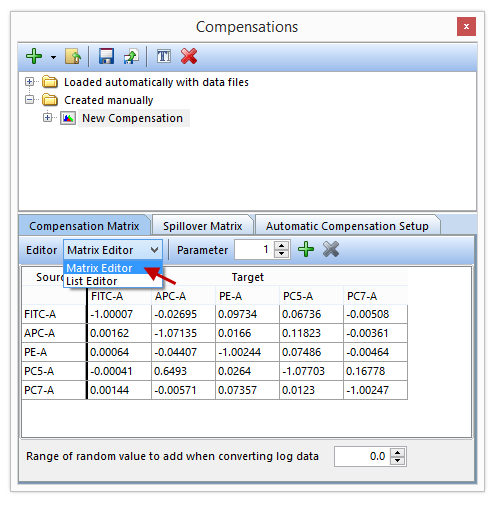
Figure T8.18 - The Compensation Matrix create from the Automatic Compensation Setup. The red box indicates you can change from Matrix Editor to List Editor view. The Spillover Matrix tab will display the spillover matrix for your compensation definition.
我们将转换回一页视图,然后应用新的自动补偿到一个多色对照中。
| 28. | 点击View(视图)标签→Multiple Pages(多重页面)→One Page(单页型)。 |
| 29. | 点击Compensation Samples(补偿样本)页面标签转换到版面的第一页(图T8.6)。 |
| 30. | 点击Compensations(补偿)导航器中的New Compensation(新的补偿)(图T8.19)。 |
| 31. | 点击鼠标左键不放,拖拽New Compensation(新补偿)到版面右上方的Compensation Controls_All Colors.fcs绘图中(见图8.19中红色箭头)。 |
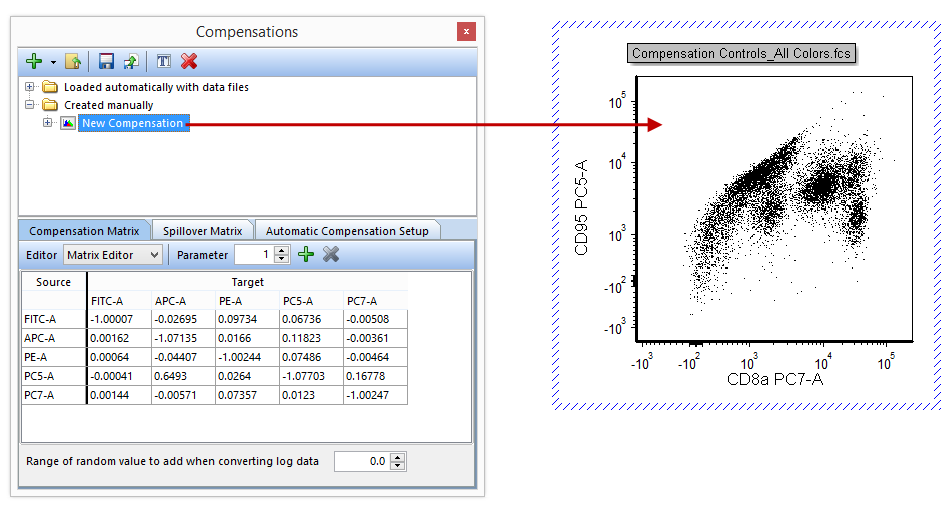
Figure T8.19 - Dragging the New Compensation definition from the Compensations navigator and dropping it on a plot will apply that compensation definition to the plot.
此绘图将被更新,然后显示适当的补偿数据(如下图T8.20所示)。
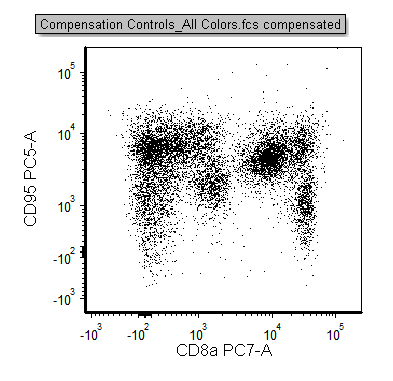
Figure T8.20 - The All Colors control plot with the compensation defined in the Automatic Compensation Setup feature applied.
Compensation(补偿)和Spillover(溢出)矩阵可添加到用户版面或者Microsoft Excel中任何地方。
| 32. | 点击New Compensation(新补偿)定义中的Compensation Matrix(补偿矩阵),并将其选中(图T8.21)。 |
| 33. | 拖拽Compensation Matrix(补偿矩阵)到版面中的空白位置,将其置于该处(图T8.21)。 |
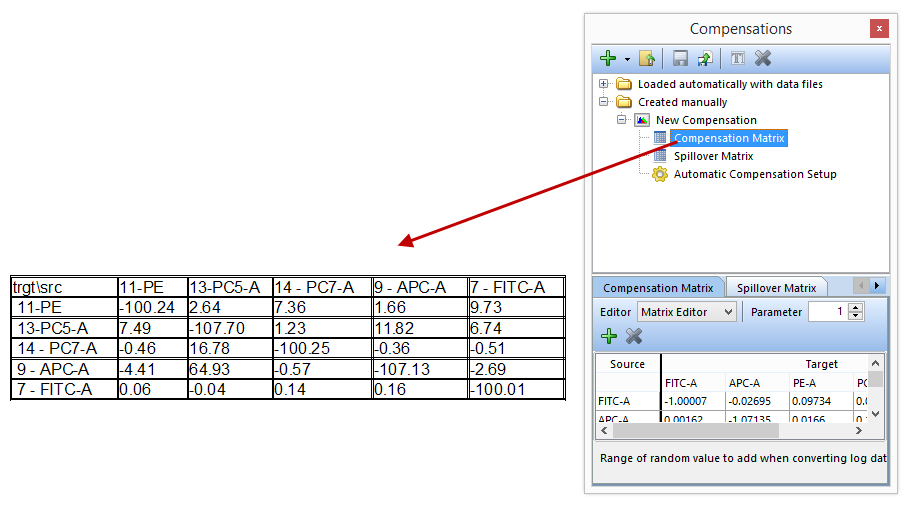
Figure T8.21 - Drag and drop the Compensation Matrix to a blank space in the layout (red arrow) to insert a text displaying all of the matrix values.
此补偿矩阵就将显示在一个文本框中(图T8.21)。如果您想让矩阵显示于Microsoft Excel中,您可重复步骤32和33步,将其拖拽到其中。
此时,自动补偿设置已经完成,虽然第3步-调节参数(可选操作)和第4步-增加额外的溢出目标(可选操作)在改善您的单染群体时可被使用(Adjust parameters(调节参数))或者在未定义源的情况下,增加其他的目标定义(增加额外溢出目标)。如果用户想了解更多关于此功能的介绍,请参见“自动补偿-可选操作第3步和第4步”一节。
请参见“手动调节补偿”教程或者“Compensation(补偿)”教程的手动调节部分。
注意:在运行用户自己数据时,可能会出现如图T8.22所示的数字化误差。发生的原因主要是您使用对数的方法转换FCS 2.0 数据。如果您想要改正数字化误差,请参见“补偿数字化误差”一节。
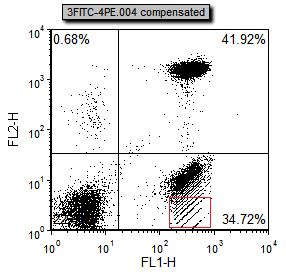
Figure T8.22 - Digitization errors after compensation can be seen in the red box. Please refer to the Compensation Digitization Errors tutorial to correct this type of error.
